Fig. 1.
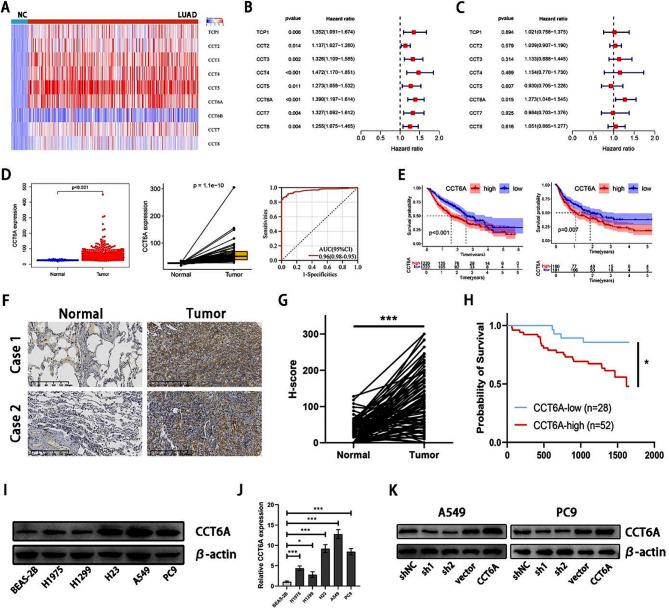
CCT6A was highly expressed in LUAD and negatively correlated with the prognosis. (A) Heatmap of the CCT family gene expression in LUAD based on TCGA. (B) Univariate Cox analysis of the prognosis-related CCT family genes based on TCGA. (C) Multivariate Cox analysis of the prognosis-related CCT family genes based on TCGA. (D) Unpaired (left) and paired (middle) t tests of CCT6A expression between LUAD and normal tissues and ROC curve showing the sensitivity and specificity to predict the occurrence of LUAD (right) based on TCGA. (E) Kaplan Meier plots showing the significant difference of OS (left) and PFS (right) in LUAD patients between the CCT6A-high and CCT6A-low samples based on GSE68465. (F) Representative IHC plots of tumor and paired normal tissues (20×magnification). Scale bars = 200 μm. (G) Paired t tests of the H-score between tumor and normal tissues. (H) Kaplan Meier plots showing the significant difference of OS in LUAD patients with CCT6A-high and CCT6A-low tissues. (I) CCT6A protein expression in normal lung epithelial cell line and different LUAD cell lines. (J) CCT6A mRNA expression in normal lung epithelial cell line and different LUAD cell lines. (K) The transfection efficiency of shRNAs and plasmid in A549 and PC9 cell lines

