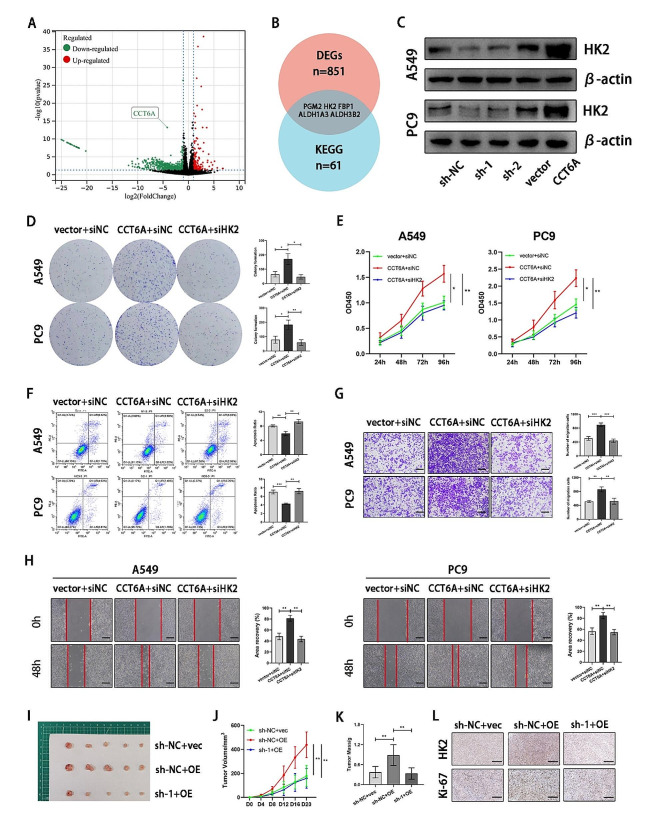
Fig. 4.
Oncogenic role of CCT6A depended on HK2. (A) Volcano plot of genes significantly downregulated or upregulated upon CCT6A knockdown. (B) Venn diagram of differential genes (|log2FC|>1, P < 0.05) upon CCT6A knockdown and associated with the glycolysis metabolism. (C) HK2 expression in cells infected with sh-NC, sh-CCT6A, vector, and CCT6A-OE plasmid were shown by WB. (D-E) Colony formation assays and growth curves (days 1–4) represented the proliferation of A549/PC9 cells treated with vector or CCT6A-OE plasmid plus siNC/siHK2, Representative images of the crystal violet staining of cells in a 6-well plate and statistics were shown. (F) HK2 knockdown reversed the deceased apoptosis induced by CCT6A overexpression. Representative FACS images and statistics based on three independent experiments were shown. (G) Transwell assays showed migration of vector/CCT6A-overexpression infected A549/PC9 cells with siNC/siHK2 (10×magnification). Scale bars = 100 μm. (H) Scratch wound healing represented the migration of A549/PC9 cells treated with vector or CCT6A-OE plasmid plus siNC/siHK2 (10× magnification). Scale bars = 100 μm. (I) Representative images of subcutaneous tumors on the left flank of mice injected with A549/PC9 cells treated with sh-NC or sh-1 plus vector/HK2-OE plasmid (n = 5, each group). (J) Tumor growth curves were plotted every 4 days to 20days. (K) The weight of tumors was measured. (L) Representative images of IHC staining for HK2 and Ki67 proteins (20×magnification). Scale bars = 100 μm. * P < 0.05; ** P < 0.01; *** P < 0.001. Variables are presented as mean ± SD

