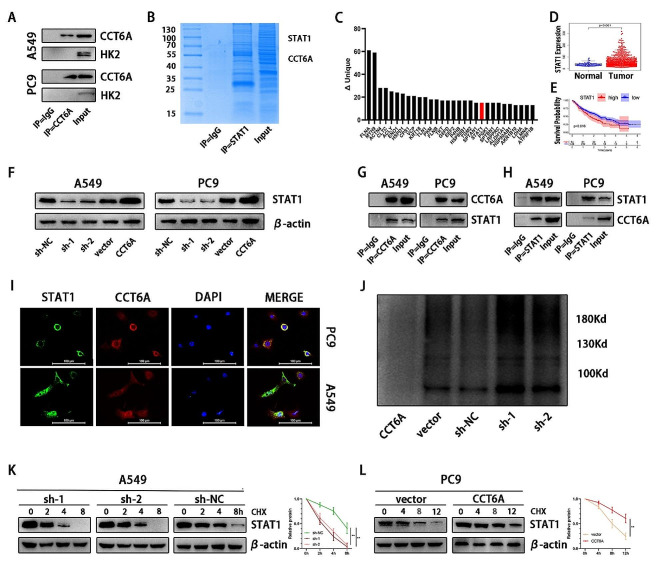
Fig. 6.
CCT6A bound and stabilized STAT1 protein. (A) Immunoprecipitation of cell lysates from A549/PC9 cells using anti-CCT6A or IgG antibodies, and immunoprecipitants were blotted with anti-CCT6A or anti-HK2 antibodies. (B) Coomassie blue staining of proteins immunoprecipitated by anti-CCT6A or IgG antibodies and input. (C) Bar plot showing proteins specifically binding with CCT6A. (D) Unpaired t tests of STAT1 expression between LUAD and normal tissues based on TCGA. (E) Kaplan Meier plots showing the significant difference of OS in LUAD patients between the STAT1-high and STAT1-low samples based on TCGA. (F) STAT1 expression in A549/PC9 cells infected with sh-NC/sh-CCT6A or vector/CCT6A-OE plasmid shown by WB. (G-H) Immunoprecipitation of cell lysates from A549/PC9 cells using anti-CCT6A, anti-STAT1 or IgG antibodies, and immunoprecipitants were blotted with anti-STAT1 or anti-CCT6A antibodies. (I) Immunofluorescence images showing the distribution of CCT6A (red) and STAT1 (green) in A549/PC9 cells (40×magnification). Scale bars = 100 μm. (J) After 48 h transfection, A549 cells overexpressed CCT6A were treated with MG132 for 8 h and followed by IP and western blot. (K) A549 cells infected with CCT6A knockdown were treated with CHX for indicated time and immunoblotting analysis was performed. (L) PC9 cells infected with CCT6A overexpression were treated with CHX for indicated time and immunoblotting analysis was performed. * P < 0.05; ** P < 0.01; *** P < 0.001. Variables are presented as mean ± SD

