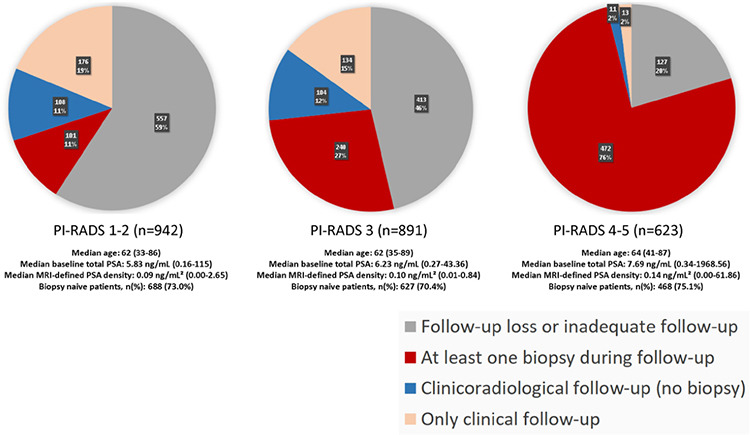
Figure 2.

In the main dataset, the rates of follow-up loss for Prostate Imaging Reporting and Data System (PI-RADS) 1–2, PI-RADS 3, and PI-RADS 4–5 subgroups are 59%, 46%, and 20%, respectively. Meanwhile, the rates of undergoing at least one biopsy during follow-up are 11%, 27%, and 76% for these categories, in the order given. Consequently, as the initial PI-RADS category increases, follow-up losses decrease, and the probability of undergoing biopsy during follow-up increases. Each distinct PI-RADS subgroup within the main dataset exhibits similar characteristics concerning age, baseline prostate-specific antigen (PSA) levels, magnetic resonance imaging-defined PSA density, and prior biopsy status, with corresponding PI-RADS cohorts included in the survival analysis.
