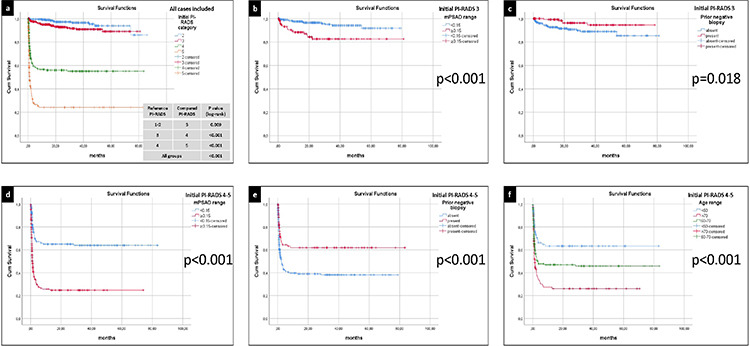
Figure 3.

(a) The clinically significant prostate cancer (cs-PCa) diagnosis-free survival curves of all cases included in the survival analysis, stratified by the initial Prostate Imaging Reporting and Data System (PI-RADS) category. Among all PI-RADS cohorts, a statistically significant inverse correlation was identified between the initial PI-RADS category and cs-PCa diagnosis-free survival (P < 0.001). (b) The cs-PCa diagnosis-free survival curves of the PI-RADS 3 cohort, stratified by initial magnetic resonance imaging-defined prostate-specific antigen density (mPSAD) range. A higher probability of survival was observed in the low mPSAD (<0.15 ng/mL2) subgroup (P < 0.001). (c) The cs-PCa diagnosis-free survival curves of the PI-RADS 3 cohort, stratified by prior biopsy status. Biopsy-naïve cases exhibited a lower probability of cs-PCa diagnosis-free survival (P = 0.018). (d) The cs-PCa diagnosis-free survival curves of the PI-RADS 4–5 cohort, stratified by initial mPSAD range. The subgroup with a high mPSAD (≥0.15 ng/mL2) demonstrated a lower probability of cs-PCa diagnosis-free survival (P < 0.001). (e) The cs-PCa diagnosis-free survival curves of the PI-RADS 4–5 cohort, stratified by prior biopsy status. Cases with a history of prior negative biopsy displayed a higher probability of survival without a cs-PCa diagnosis (P < 0.001). (f) The cs-PCa diagnosis-free survival curves of the PI-RADS 4–5 cohort, stratified by age group. A negative correlation was observed between the age range and the probability of a cs-PCa diagnosis-free survival (P < 0.001).
