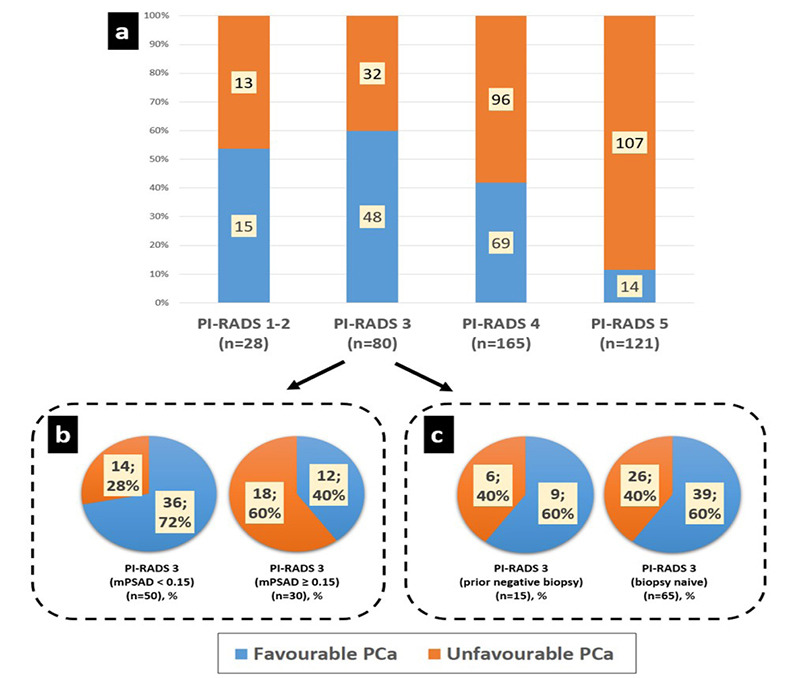
Figure 4.

(a) Unfavorable prostate cancer (PCa) percentages in Prostate Imaging Reporting and Data System (PI-RADS) 1–2, 3, 4, and 5 groups were 46%, 40%, 58%, and 88%, respectively. The PI-RADS 1–2 and 3 groups exhibited similar prognostic distribution regarding unfavorable PCa (P = 0.55). However, comparing PI-RADS ≤3, 4, and 5 subgroups revealed statistically significant differences concerning unfavorable PCa rates, which were positively correlated with the initial PI-RADS category (P < 0.001). (b, c) In subgroup analyses, the PI-RADS 3 group was evaluated in terms of magnetic resonance imaging-defined prostate-specific antigen density (mPSAD) range (b) and prior biopsy status (c) for prognostic assessment. The rate of unfavorable PCa was 28% in the low mPSAD (<0.15 ng/mL2) subgroup and increased to 60% in the high mPSAD (≥0.15 ng/mL2) subgroup (P = 0.005). Conversely, prior biopsy status had no statistically significant impact on prognostic distribution (P = 1).
Very low-risk, low-risk, and intermediate risk-favorable PCa cases according to National Comprehensive Cancer Network (NCCN) classification were accepted as favorable PCa. Intermediate risk-unfavorable, high-risk, and very high-risk PCa cases according to NCCN classification were accepted as unfavorable PCa.
