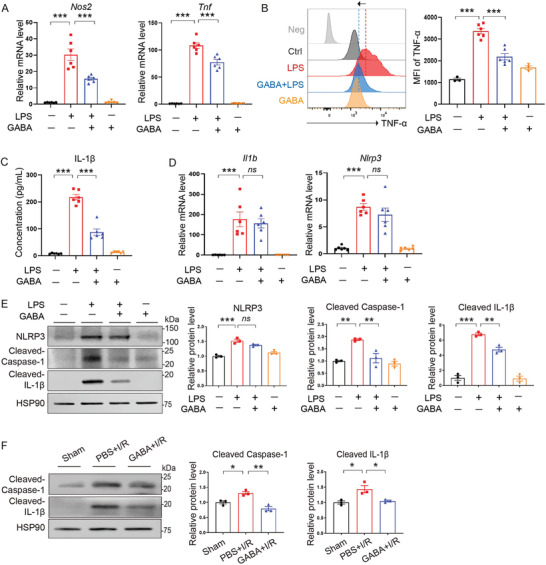
Figure 6.

GABA inhibited the polarization of macrophages toward proinflammation. A) qRT‐PCR analysis showing the mRNA levels of Nos2 and Tnf in LPS‐stimulated BMDM in the presence or absence of GABA. n = 6 per group. ***, p < 0.001 (one‐way ANOVA with post hoc Tukey test). B) Flow cytometry analysis showing the mean fluorescence intensity (MFI) of M1 surface marker TNF‐α in macrophages. n = 3 in Ctrl and GABA group, n = 6 in LPS and LPS+GABA group. ***, p < 0.001 (one‐way ANOVA with post hoc Dunnett's test). C) Measurement of IL‐1β secretion in cell culture supernatants by ELISA. Data are shown as the mean ± SEMs, n = 6 per group; ***, p < 0.001 (one‐way ANOVA with post hoc Tukey test). D) qRT‐PCR analysis showing the mRNA levels of Il1b and Nlrp3. n = 6 per group. ns, not significant; ***, p < 0.001 (one‐way ANOVA with post hoc Tukey test). E) Immunoblotting analysis showing the protein levels of NLRP3, cleaved Caspase‐1, and cleaved IL‐1β in BMDM. n = 3 per group. ns, not significant; **, p < 0.01; ***, p < 0.001 (one‐way ANOVA with post hoc Tukey test). F) Immunoblotting analysis showing the protein levels of cleaved Caspase‐1 and cleaved IL‐1β in heart tissues. n = 3 per group. *, p < 0.05; **, p < 0.01 (one‐way ANOVA with post hoc Tukey test). GABA, γ‐aminobutyric acid; LPS, Lipopolysaccharide; Nos2, Inducible nitric oxide synthase; Tnf/TNF‐α, Tumor necrosis factor‐α; Nlrp3/NLRP3, NOD‐, LRR‐ and pyrin domain‐containing protein 3; Il1b/IL‐1β, Interleukin‐1β; Caspase‐1, cysteine aspartate specific protease‐1; HSP90, heat shock protein 90.
