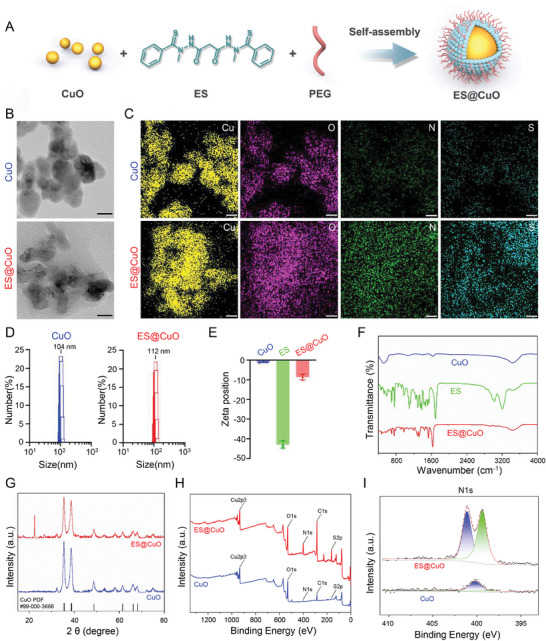
Figure 1.

Preparation and characterization of ES@CuO. A) Schematic diagram of the preparation of ES@CuO NPs. B) Representative transmission electron microscopy (TEM) images of CuO NPs and ES@CuO NPs. Scale bar: 20 nm. C) Representative element maps (Cu, O, N, and S) of CuO NPs and ES@CuO NPs. Scale bar: 20 nm. ES formula: C19H20N4O2S2. D) and E) The hydrodynamic size distributions and zeta potentials of CuO NPs and ES@CuO NPs (in ultrapure water) (n = 3). F) Fourier transform infrared (FTIR) spectra of CuO NPs, ES, and ES@CuO NPs. G) XRD analysis of CuO NPs and ES@CuO NPs. H) XPS analysis of CuO NPs and ES@CuO NPs. I) High‐resolution N1s XPS spectra of CuO NPs and ES@CuO NPs. The data are presented as the mean ± SD.
