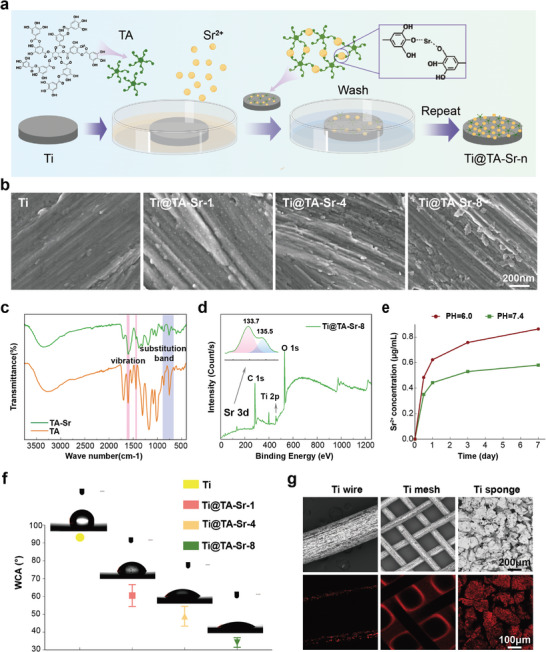
Figure 1.

a) Schematic illustration of the stepwise assembly of MPN on Ti plates. b) Surface morphology of different samples observed by SEM. c) FTIR spectra of TA and TA‐Sr. d) XPS spectra of Ti@TA‐Sr‐8. Survey scan and Sr 3d high‐resolution spectrum (inserted). e) The cumulative release profile of Sr2+ release from Ti@TA‐Sr‐8 in PBS at pH 7.4 and pH 6.0. f) WCA and corresponding photos of droplets on various samples. g) Representative CLSM photos of MPN coatings on different Ti substrates with the corresponding SEM photos. The error bar represented mean ± SD (n = 5).
