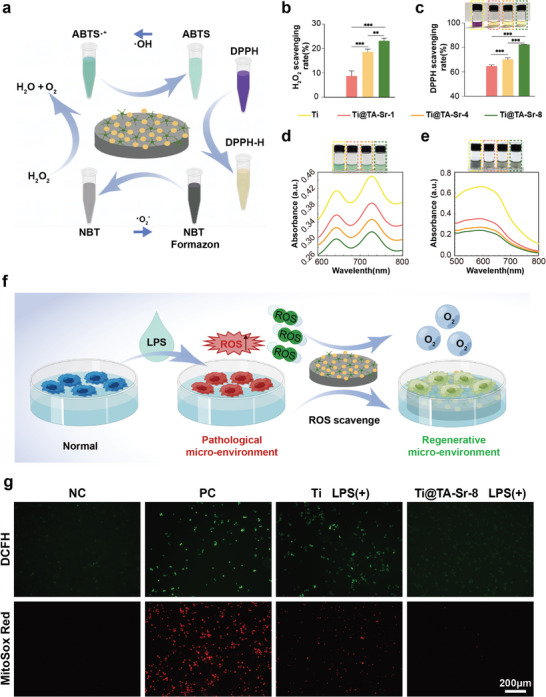
Figure 2.

a) A schematic plot about the radical scavenging capacity of the coatings against different radicals: H2O2, O2 −, ·OH, and DPPH. b) H2O2 scavenging rate of different groups (n = 5). c) DPPH scavenging rate and the corresponding digital photos (n = 5). d,e) UV–vis absorption spectra and corresponding photos of the catalyzed oxidation of ABTS (734 nm) by ·OH and NBT (560 nm) by O2 − on different groups of TA‐Sr. f) A schematic diagram of TA‐Sr reshaping the pathological micro‐environment into a regenerative one by scavenging ROS. g) Representative fluorescent images of DCFH staining for intracellular ROS and MitoSOX staining for mitochondrial ROS in macrophages incubated with LPS. The data (b,c) were analyzed by one‐way ANOVA test. The error bar represented mean ± SD, ** P <0.01, and *** P <0.001.
