Figure 3.

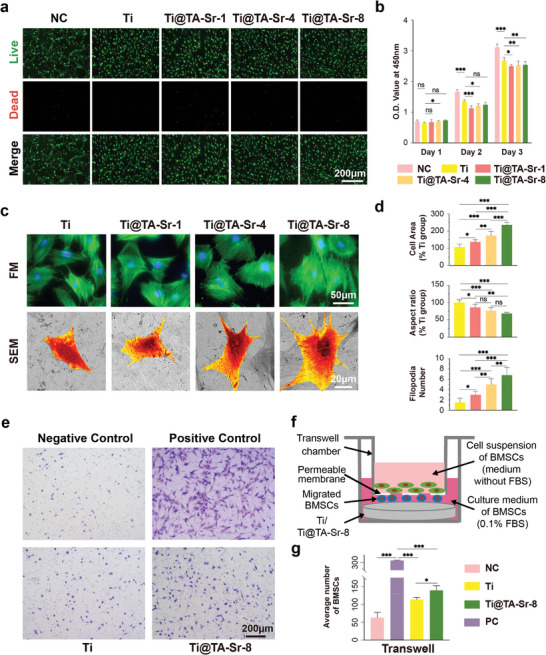
a) Live/dead staining of BMSCs after 24 h of culture (live cells, green; dead cells, red); b) Proliferation of BMSCs cultured on various samples measured by CCK‐8 (n = 6); c) Morphologies of BMSCs after 24 h of culture captured by fluorescence microscope (phalloidin‐FITC: cytoskeleton, green; DAPI: nuclei, blue) and SEM (BMSCs were pseudocolored orange for visual observation); d) Quantitative analysis of the average cell area, aspect ratio and filodopia numbers of adhesive cells according to the SEM result (n = 10); f) Schematic illustration of transwell migration assay; e) Representative pictures of BMSCs that migrated to the proximal surface toward the Ti plates (stained by crystal violet); g) Quantitative comparison of migrated cells (n = 5). The data (b,d, and g) were analyzed by one‐way ANOVA test. The error bar represented mean ± SD; ns, no significance, * P <0.05, ** P < 0.01, and *** P < 0.001.
