
Figure 5.
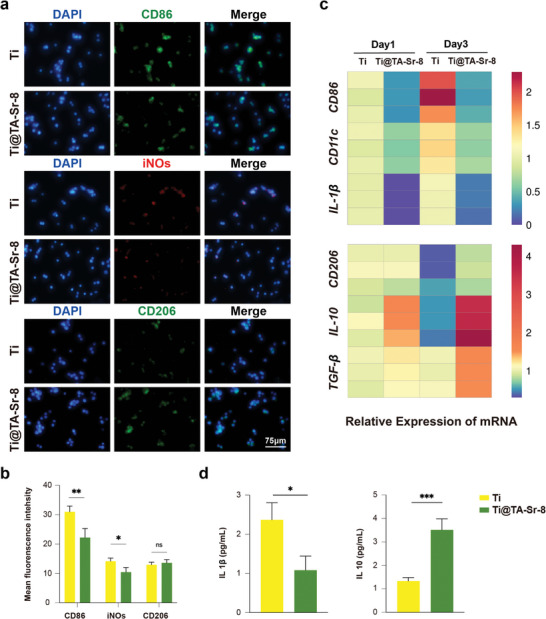
Effect on macrophage polarization of TA‐Sr coatings. a) Typical immunofluorescent images of macrophages cultured on Ti and Ti@TA‐Sr‐8 for 24 h: CD86 (M1 marker, green), iNOs (M1 marker, red), CD206 (M2 marker, green), DAPI (nucleus, blue); b) quantitative analysis of fluorescence intensity (n = 5); c) Heat map of gene relative expressions in macrophage cultured for 1 day and 3 days (n = 3); d) IL‐1β and IL‐10 level of macrophage on day 3 measured by ELISA (n = 3). The data (b,d) were analyzed by two‐tailed unpaired Student's t‐test. The error bar represented mean ± SD; ns, no significance, * P < 0.05, ** P < 0.01, and *** P < 0.001.