Figure 6.

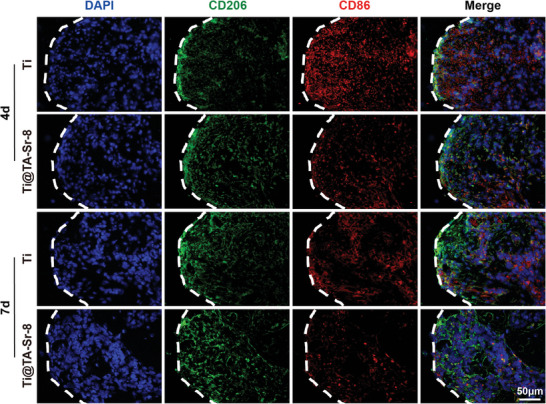
Representative fluorescent images showing the expression of CD86 (M1 marker, red), and CD206 (M2 marker, green) at the bone‐implant interface (indicated as white dashed lines) 4 and 7 days after implantation.

Representative fluorescent images showing the expression of CD86 (M1 marker, red), and CD206 (M2 marker, green) at the bone‐implant interface (indicated as white dashed lines) 4 and 7 days after implantation.