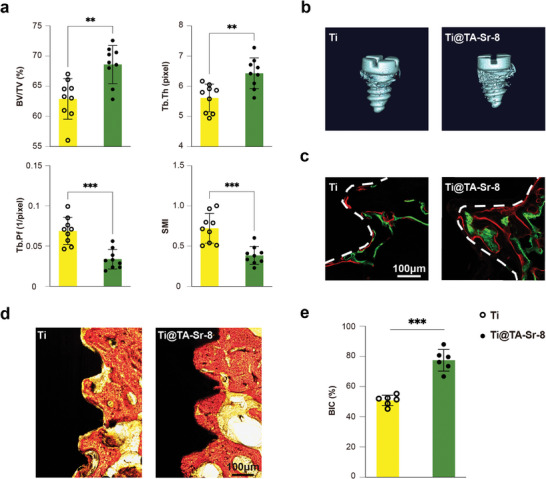
Figure 7.

TA‐Sr coatings promoting osseointegration in vivo. a) Micro‐CT analysis of bone regeneration 4 weeks post‐implantation (n = 9); b) Representative 3D reconstructed Micro‐CT images of new bone around different implants; c) Double fluorochrome labeling (green: calcein, week 1; red: alizarin complexone, week 2) at bone‐implant interface (indicated as white dashed line); d) Histological observation of new bone formation at the bone‐implant interface by Van Gieson's staining (red: mineralized bone matrix; yellow: the other tissues; dark: implant); e) quantitative analysis of BIC percentage (n = 6). The data (a,e) were analyzed by two‐tailed unpaired Student's t‐test. The error bar represented mean ± SD; ns, no significance, ** P < 0.01 and *** P < 0.001.
