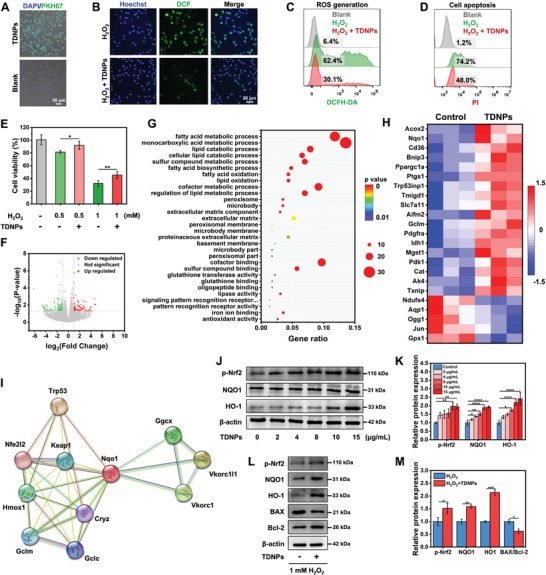
Figure 4.

Characterization of TDNPs in fibroblasts. A) Uptake of TDNPs by L929 cells. B) Intracellular ROS level of L929 cells treated with H2O2 and H2O2 + TDNPs (n = 3). C) Flow cytometry analysis of L929 cells handled with PBS, H2O2, and H2O2 + TDNPs, using the DCFH‐DA probe as an indicator (n = 3). D) Cell apoptosis of L929 cells after different treatments (n = 3). E) Viability of L929 cells under different conditions (n = 5). F) Volcano plot analysis of DEGs in L929 cells and TDNPs‐treated L929 cells. G) GO enrichment analysis of the up‐regulated DEGs. H) Upregulated and downregulated genes involved in oxidative stress after TDNPs treatment (fold change ≥ 2 and p < 0.05) (n = 3). I) Cytoscape plot of STRING protein–protein interaction analysis of Nqo1. J) Western blot analysis of endogenous antioxidant markers p‐Nrf2, NQO1, and HO‐1 in L929 cells after treatment with TDNPs (n = 3). K) Quantification of protein expression levels of p‐Nrf2, NQO1, and HO‐1 (corresponding to(J)) (n = 3). Values are normalized to that of L929 cells treated with control. L) Western blot analysis of endogenous antioxidant markers of L929 cells under H2O2 and H2O2 + TDNPs treatments, respectively (n = 3). M) Quantification of protein expression levels of p‐Nrf2, NQO1, HO‐1, and BAX/Bcl‐2 (corresponding to(L)) (n = 3). Values are normalized to that of L929 cells treated with control. Data are presented as mean ± SD. Statistical significance was based on Student's t‐test and one‐way ANOVA with post‐hoc test; *p < 0.05, **p < 0.01, ***p < 0.001, and ****p < 0. 0001. TDNPs, turmeric‐derived nanoparticles; ROS, reactive oxygen species; PBS, phosphate buffer saline; DCFH‐DA, dichlorodihydrofluorescein diacetate; DEGs, differentially expressed genes; GO, gene ontology; STRING, search tool for recurring instances of neighboring genes.
