Figure 6.

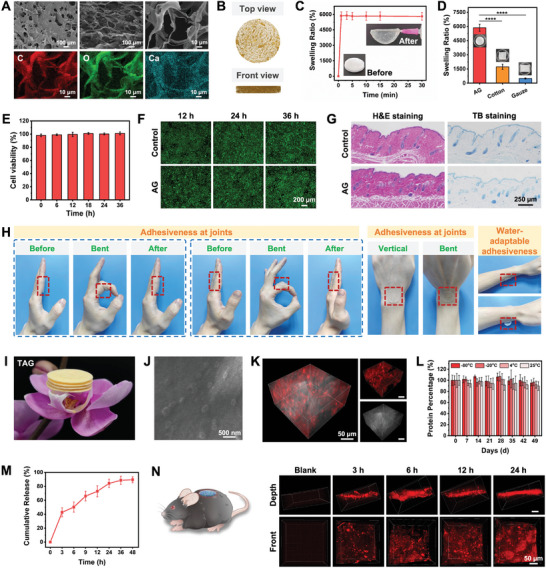
Characterization of TAG. A) SEM image and energy dispersive X‐ray analysis of the aerogel (AG). B) Microtomography of AG showing porous structure. C) Swelling property of AG. The inserts show the AG before and after soaking in water. D) Swelling ratio of AG, medical cotton, and gauze (n = 3). E,F) Cytotoxicity of AG in L929 cells (n = 5). G) Histological analysis of skin samples collected from mice treated with AG or control (n = 3). H) Adhesion of AG on joints and skin surface. I) Picture showing four patches of TAG on a flower. J) SEM image of TAG with TDNPs inside the matrix. K) Distribution of TDNPs within AG. Red fluorescence represents DID‐labeled TDNPs. L) Remaining protein in TAG under different storage conditions for 49 days (n = 3). M) Release pattern of TDNPs from TAG (n = 3). N) Penetration of TDNPs into the skin tissues. Data are shown as mean ± SD. Statistical significance was based on one‐way ANOVA with post‐hoc test; ****p < 0.0001. TAG, TDNPs‐loaded aerogel (TDNPs@AG); H&E, hematoxylin and eosin; SEM, scanning electron microscope.
