
Figure 7.
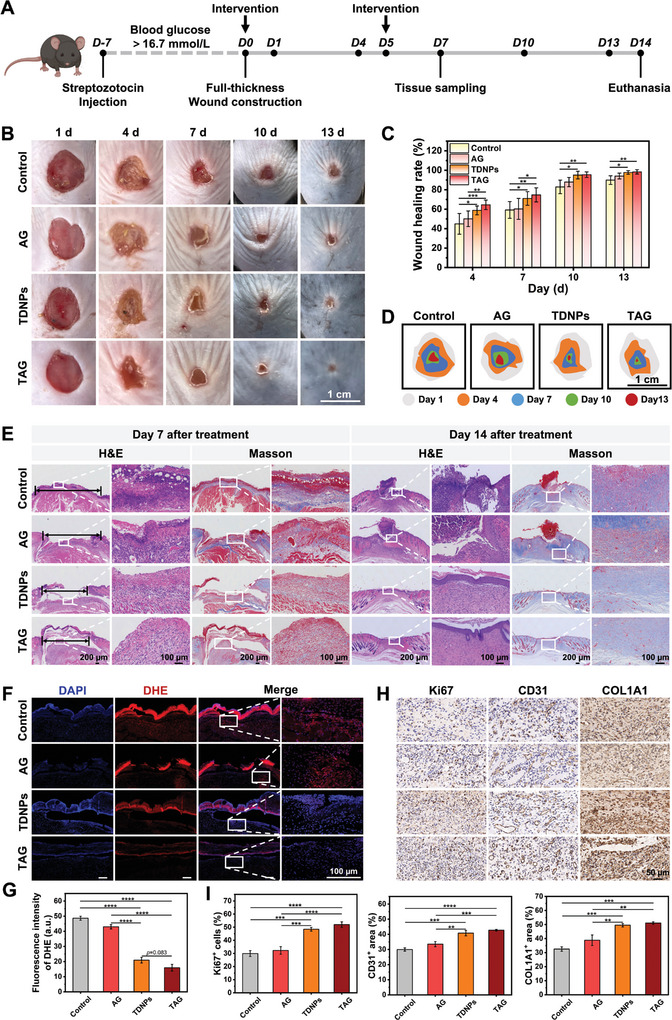
In vivo wound‐healing effect of TAG. A) Flowchart of experimental procedures. B) Representative photographs of diabetic wounds treated with different formulations on days 1, 4, 7, 10, and 13, respectively. C) Wound contractions of mice treated with PBS, AG, TDNPs, or TAG (n ≥ 7). D) Schematic images of diabetic wound contraction in mice within 13 days of treatment with different formulations. E) H&E and Masson's trichrome staining of the wound tissues obtained from diabetic mice with varied dressings on days 7 and 14, respectively (n = 3). F) Representative DHE staining images of diabetic wounds in each group. G) Statistical data of DHE fluorescence intensity at the wound bed on day 7 (n = 3). H) Representative images of Ki67, CD31, and COL1A1 expressions in different groups of tissues. I) Statistical data of Ki67+ cells, CD31+ area, and COL1A1+ area in tissues obtained from different groups (n = 3). Data are presented as mean ± SD. Statistical significance was based on one‐way ANOVA with post‐hoc test; *p < 0.05, **p < 0.01, ***p < 0.001, and ****p < 0.0001. TDNPs, turmeric‐derived nanoparticles; TAG, TDNPs‐loaded aerogel (TDNPs@AG); PBS, phosphate buffer saline; AG, aerogel; DHE, dihydroethidium; H&E, hematoxylin and eosin.