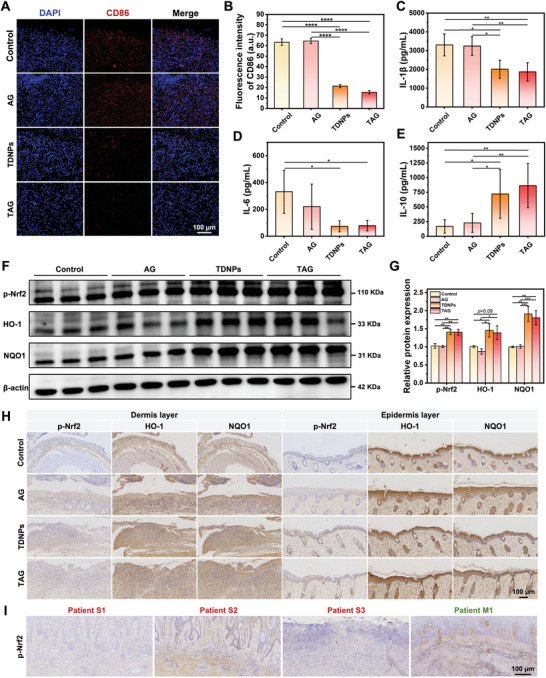
Figure 8.

In vivo anti‐inflammatory and antioxidant effect of TAG. A) Representative images of immunofluorescence staining with CD86 in diabetic cutaneous ulcer tissue obtained from mice with varied dressing. B) Quantification of fluorescence intensity (CD86) (n = 3). C–E) Statistical analysis of IL‐1β, IL‐6, and IL‐10 in skin tissue, measured using ELISA (n = 7). F) Western blot analysis of p‐Nrf2, HO‐1, and NQO1 in wound tissues obtained from mice with varied dressings. G) Quantification of protein expression levels of p‐Nrf2, HO‐1, and NQO1 (corresponding to(F)) (n = 3). Values are normalized to that of L929 cells treated with control. H) Representative images of p‐Nrf2, NQO1, and HO‐1 expression wound tissues obtained from mice with varied dressings. I) Expression of p‐Nrf2 in skin tissues obtained from DFU patients. Data are presented as mean ± SD. Statistical significance was based on one‐way ANOVA with post‐hoc test; a non‐parametric Wilcoxon rank‐sum test was used to assess the IL‐1β and IL‐6 ELISA data; *p < 0.05, **p < 0.01, ***p < 0.001, and ****p < 0.0001. TDNPs, turmeric‐derived nanoparticles; AG, aerogel; TAG, TDNPs‐loaded aerogel (TDNPs@AG); ELISA, enzyme‐linked immunosorbent assay.
