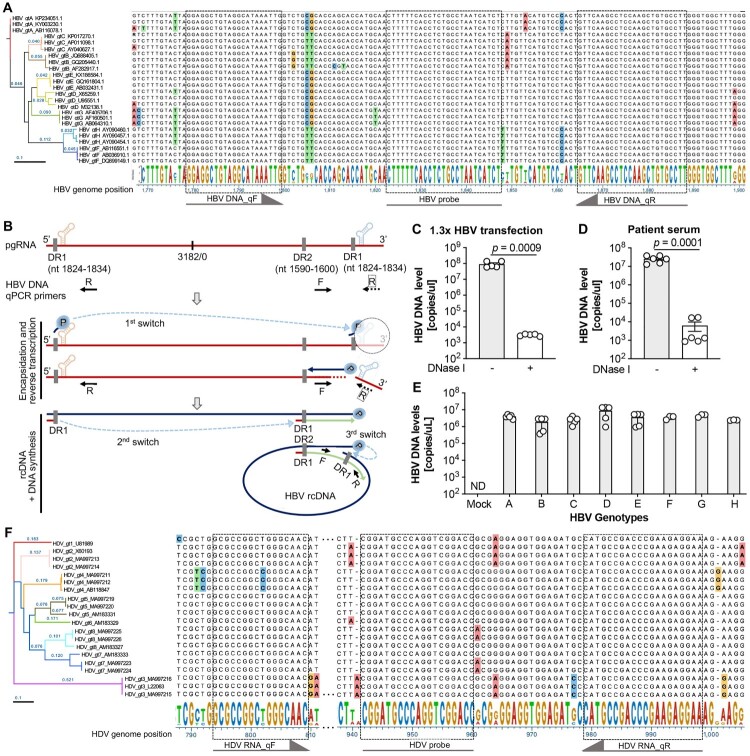
Figure 2.
The HBV and HDV dual channel system can be used for pan-genotype HBV DNA and HDV RNA detection. (A) HBV quantitative PCR primer and probe designment based on the alignment and phylogenetic assay of HBV genomes of different genotypes (A–H). The phylogenetic tree (performed by DNASTAR, the phylogeny was computed using Maximum Likelihood RAxML, order ascending by distance) shows the genome difference among genotypes and for each HBV genotype three representative genomes were used. Sequence alignment was performed under the Clustal W algorithm and non-conserved nucleotides were labelled with different colours. The conserved regions were used for primers and probe designment which were indicated by dashed lines and arrows. (B) Schematic to show the specificity of secreted HBV rcDNA but not HBV pgRNA detection of the HBV and HDV dual channel system. HBV pgRNA was shown with the epsilon structures and the direct repeat elements (DR) in 5’ and 3’ primes. The qPCR primers for HBV DNA in the HBV and HDV dual channel system are shown accordingly based on the HBV genome position. Characterization of the HBV DNA but not HBV pgRNA specific detection by using the supernatants after HBV infectious clone transfection (C) and sera from HBV infected patients (D). Data shown as mean ± SD of 5 biological replicates (C) or 6 patient samples (D). Statistical significance was determined applying an unpaired two-tailed t test. (E) The pan-genotypic detection of HBV DNA in the HBV and HDV dual channel quantification system is validated by detecting the supernatants after HBV different genotype (A–H) plasmid transfection, respectively. Data shown as mean ± SD of at least 3 biological replicates. (F) HDV quantitative PCR primer and probe design based on the alignment and phylogenetic assay of HDV genomes of different genotypes (1–8). The phylogenetic tree (performed by DNASTAR, the phylogeny was computed using Maximum Likelihood RAxML, order ascending by distance) shows the sequence difference across genotypes and for each HDV genotype three representative genomes were used. Sequence alignment was performed under the Clustal W algorithm and non-conserved nucleotides were labelled with different colours. The conserved regions were used for primers and probe designment which were indicated by dashed lines and arrows.

