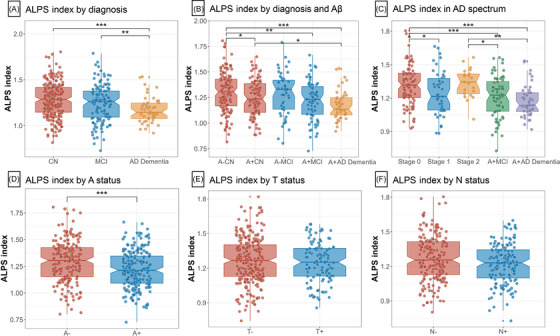
FIGURE 2.

ALPS indexes by diagnosis and biological stages. The graphs display the 95% CIs around the median of raw values of each plasma biomarker. ALPS indexes were Box–Cox transformed for normalization prior to the analysis. Statistical analyses were conducted using analyses of covariance controlling for age, sex, education, and APOE ε4 carrier status (A–C). Comparing ALPS indexes in different biological groups, covariates include age, sex, education, APOE ε4 carrier status, and baseline diagnoses (D–F). A status was defined by CSF Aβ42 and amyloid PET (AV45 and FBB PET) (D). T status was defined by CSF p‐tau181 and AV1451 PET (E). N status was defined by CSF t‐tau and FDG PET (F). Significant P values after FDR corrected post hoc pairwise comparisons are marked with ***P < 0.001, *P<0.05, **P<0.01, ***P<0.001. “–” indicates negative; “+” indicates positive. A, amyloid; Aβ, amyloid beta; AD, Alzheimer's disease; ALPS, analysis along the perivascular space; APOE, apolipoprotein E; AV45, florbetapir; AV1451, flortaucipir; CI, confidence interval; CN, cognitively normal; CSF, cerebrospinal fluid; FBB, florbetaben; FDG, fluorodeoxyglucose; FDR, false discovery rate; MCI, mild cognitive impairment; N, neurodegeneration; PET, positron emission tomography; p‐tau181, phosphorylated tau 181; T, tau pathology; t‐tau, total tau.
