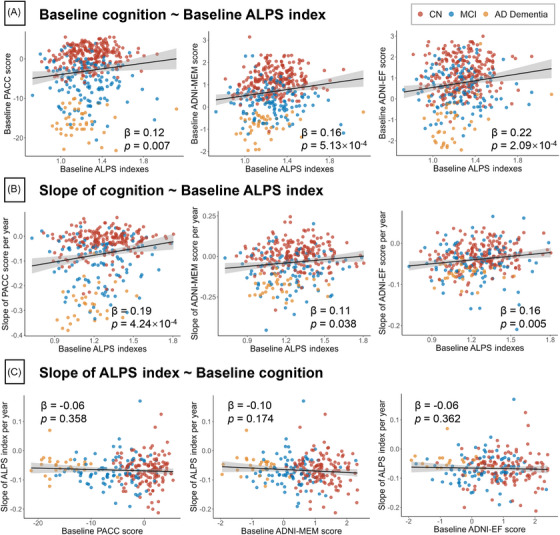
FIGURE 6.

Associations of ALPS indexes with cognitive performance. A, Cross‐sectional association between ALPS and cognitive performance. B, Association between baseline ALPS and longitudinal slope of cognitive performance. C, Association between baseline cognitive performance and longitudinal slope of ALPS. The points (red, CN; blue, MCI; yellow, AD dementia) and solid lines represent the individuals and regression lines, respectively. The regression coefficients (β) and P values were computed using a linear model across all participants, adjusting for age, sex, education, APOE ε4 carrier status. AD, Alzheimer's disease; ALPS, analysis along the perivascular space; APOE, apolipoprotein E; CN, cognitively normal; EF, executive function composite score; PACC, Preclinical Alzheimer's Cognitive Composite; MCI, mild cognitive impairment; MEM, memory composite score.
