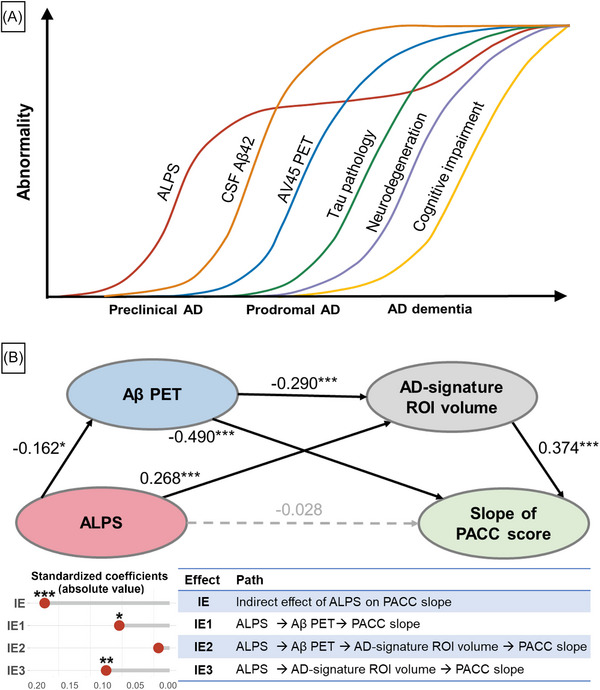
FIGURE 7.

ALPS index predicts cognition change through amyloid and neurodegeneration. A, A model integrating the findings in the present study, together with previous studies, 39 depicts an approximative order of ALPS and AD core biomarkers in the AD continuum. B, Mediation analysis based on structural equation modeling. We computed the standardized coefficients (β) of each association. P values are visualized with *P<0.05, **P<0.01, ***P<0.001. The horizontal gray line in lollipop chart represents the absolute value of β, and the color of the circle represents the positive (orange) or negative (blue) direction of β. Aβ, amyloid beta; AD, Alzheimer's disease; ALPS, analysis along the perivascular space; AV45, florbetapir; CSF, cerebrospinal fluid; PACC, preclinical Alzheimer cognitive composite; IE, indirect effect; PET, positron emission tomography; ROI, region of interest.
