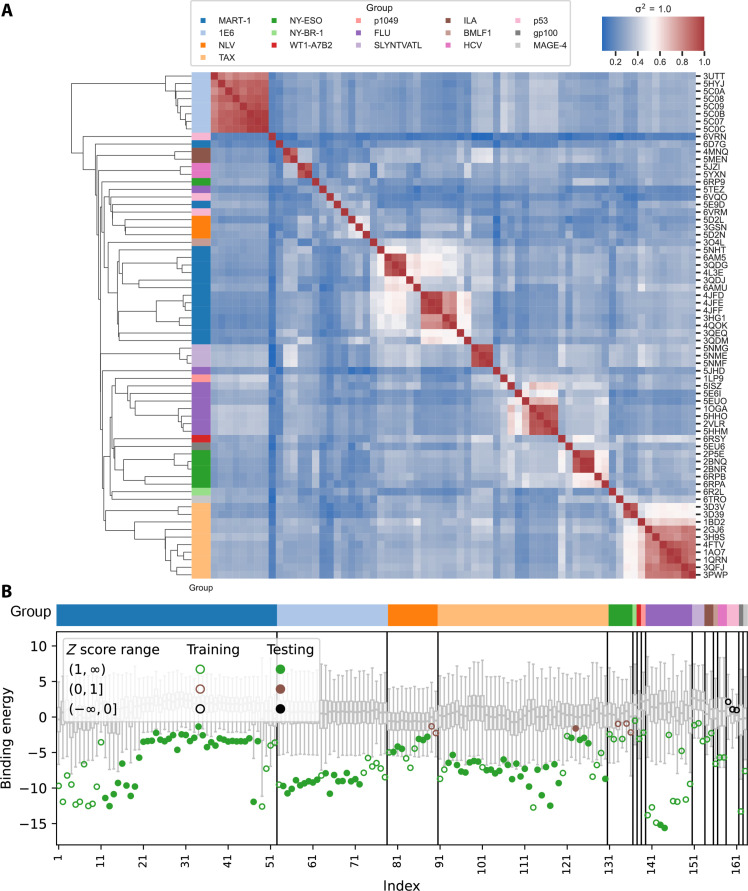
Fig. 2. Performance on ATLAS dataset.
(A) Mutual Q calculation results between all crystal structures in training set of RACER-m, which measures the structural similarity between every pair of structures from the training set. The linkage map shows the hierarchical clustering result based on the pairwise mutual Q values. Color blocks next to the linkage map indicates the corresponding cluster of the crystal structure in the row. (B) Predicted binding energies for ATLAS dataset (open circles and closed dots) in comparison with the binding energies for corresponding weak binders (box plots). Each open circle represents the predicted binding energy for a structure in the training set, while each closed dot represents the predicted binding energy for a testing case from ATLAS dataset. Each training or testing case is associated with 1000 decoy weak binders generated by randomizing the peptide sequence and pairing with the TCR in the corresponding training/testing structure. Box plots represent the distribution of the predicted energies of the decoy weak binders with the box representing the lower (Q1) to upper (Q3) quartiles and a horizontal line representing the median. The whiskers extended from the box by 1.5 IQR, where IQR indicates the interquartile range.

