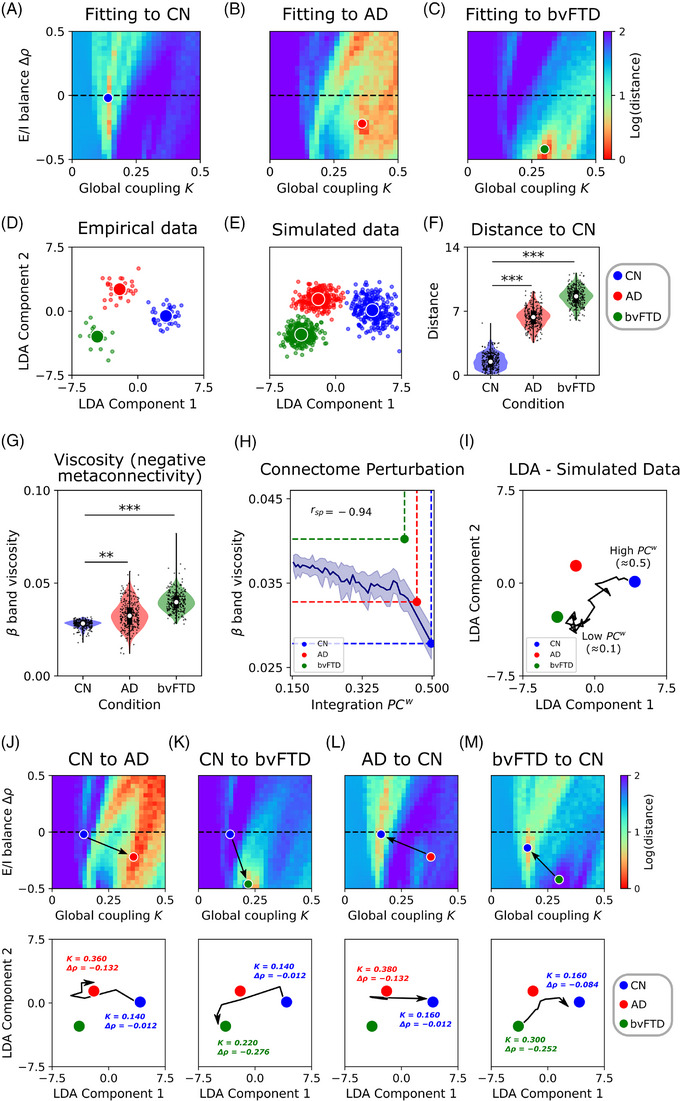
FIGURE 4.

Fitting of the model to empirical metaconnectivity features. A–C, The two parameters of the model (global coupling, , and change in target firing rate, ) were fitted to empirical data using features based on metaconnectivity and LDA. Red values, which indicate a lower distance of the simulated features to the target empirical centroids, are a hallmark of a better fit to empirical data. D, E, Empirical and simulated data (data augmentation up to 300 models’ realizations) projected using LDA. F, Distance from each simulated data point to the CN centroid. G, The simulated data showed an increment of band dynamics viscosity in AD and bvFTD, similar to the empirical results. H, Modeling of structural alterations in neurodegeneration. Healthy connectome disintegration (reducing structural integration), from right to left, is related to more viscous brain dynamics. Colored dots corresponded to the measurements of each group (simulated data). I, Trajectories from the healthy state (CN, high ) to pathological conditions. Each point in the trajectory corresponds to simulations where the connectome was sequentially perturbed decreasing its . J, K, The transition from the healthy condition (CN) to the pathological ones (AD or bvFTD) involved an increment of global coupling, , and a negative change in firing rates, , which moves the model toward hypoexcitation. In the second row, the trajectories in the LDA space corresponded to the paths marked by the black arrows in the () parameter space. The initial and final combination of parameters were drawn near their respective centroids. The opposite transition in (L, M) involved a decrease in and an increase in . *|D| > 0.5, **|D| > 0.8, ***|D| > 1.2. Data points in violin plots correspond to different model realizations (random seeds). Box plots were built using the first and third quartiles, the median, and the maximum and minimum values of distributions. Confidence intervals were built using the mean ± standard deviation. Correlations were computed using Spearman's . AD, Alzheimer's disease; bvFTD, behavioral variant frontotemporal dementia; CN, healthy control; E/I, excitatory/inhibitory; LDA, linear discriminant analysis.
