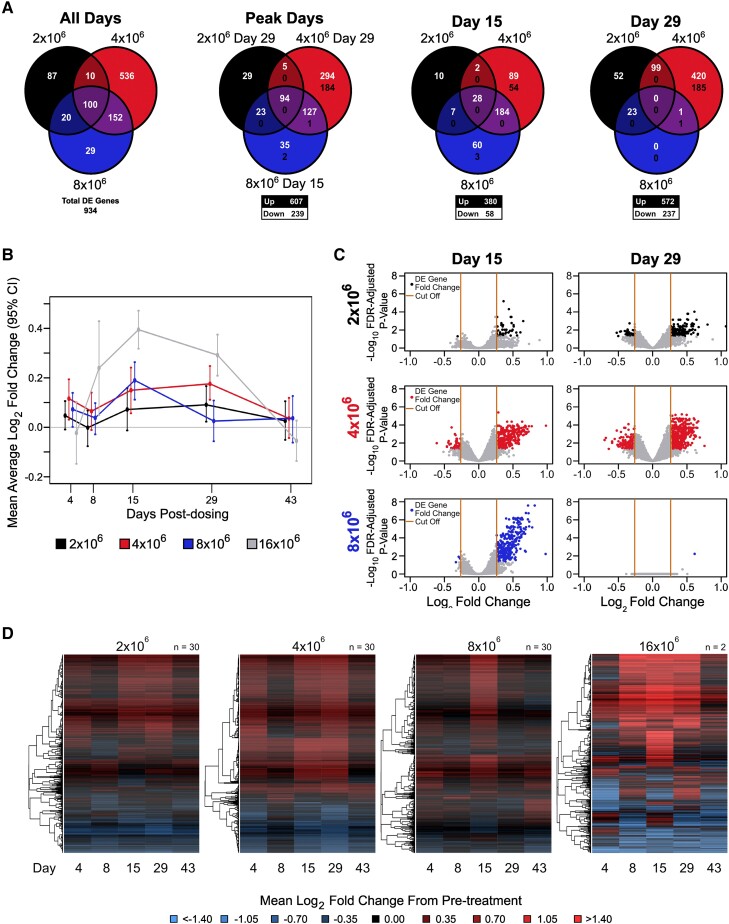
Figure 5.
Transcriptomic analysis uncovers dose- and time-dependent effects of Bacillus Calmette-Guérin challenge. A, Overlap in DE genes between challenge groups. The first panel shows overlap among a union of DE genes across all challenge groups and posttreatment days. The second panel shows overlap in the DE genes at peak response days for each challenge group. The final 2 panels show the overlap in DE genes on days 15 and 29 among the challenge groups. The numbers in white (top) and black (bottom) indicate the number of up- and downregulated genes, respectively. B, Time trend summarizing the mean log2 fold change by challenge group relative to prechallenge for DE genes identified at any time point. Error bars indicate 95% CIs of the mean based on 1000 bootstrap replicates. C, Fold change by statistical significance when days 15 and 29 are compared with prechallenge. The y-axis represents the log10-adjusted P value and the x-axis the log2 fold change for the challenge effect. The black (2 × 10⁶), red (4 × 10⁶), and blue (8 × 10⁶) dots represent DE genes. Orange lines indicate the fold change cutoff of 1.5-fold up/down. D, Log2 fold change from pretreatment among DE genes identified across posttreatment days for each dosage group. Rows represent DE genes. Columns represent mean log2 fold change at a posttreatment day. Red, upregulated vs pretreatment; blue, downregulated vs pretreatment. Dendrograms were obtained with complete linkage clustering of uncentered pairwise Pearson correlation distances between log2 fold changes. DE, differentially expressed; FDR, false discovery rate.

