Figure 7.
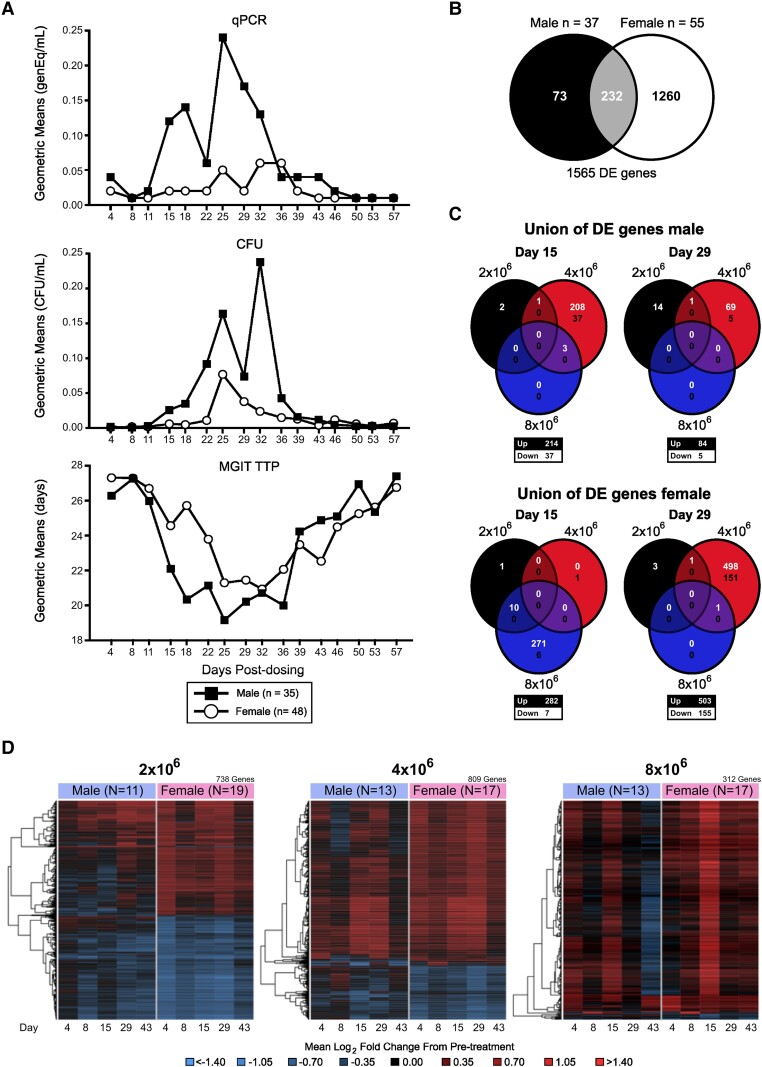
BCG challenge model identifies sex differences. Participants (n = 83) were enrolled and received 2 × 10⁶, 4 × 10⁶, or 8 × 10⁶ CFUs of BCG intradermally on day 1. A, BCG shedding at the challenge site was assessed by qPCR, CFU, or MGIT TTP. Composite results for all 3 dose groups are presented as geometric means over time, separated by males (black squares) and females (open circles). B, Overlap of DE genes between males and females. C, Overlap in DE genes across dose groups at days 15 and 29 posttreatment for males and females. The numbers in white (top) and black (bottom) indicate the number of up- and downregulated genes, respectively. D, Log2 fold change from pretreatment among a union of unique DE genes identified across sex and posttreatment days for each dose group. Rows represent DE genes. Columns represent mean log2 fold change at a posttreatment day. Red, upregulated vs pretreatment; blue, downregulated vs pretreatment. Dendrograms were obtained via complete linkage clustering of uncentered pairwise Pearson correlation distances between log2 fold changes. AUC, area under the curve; BCG, Bacillus Calmette-Guérin; CFU, colony-forming unit; DE, differentially expressed; qPCR, quantitative polymerase chain reaction; TTP, time to positivity.

