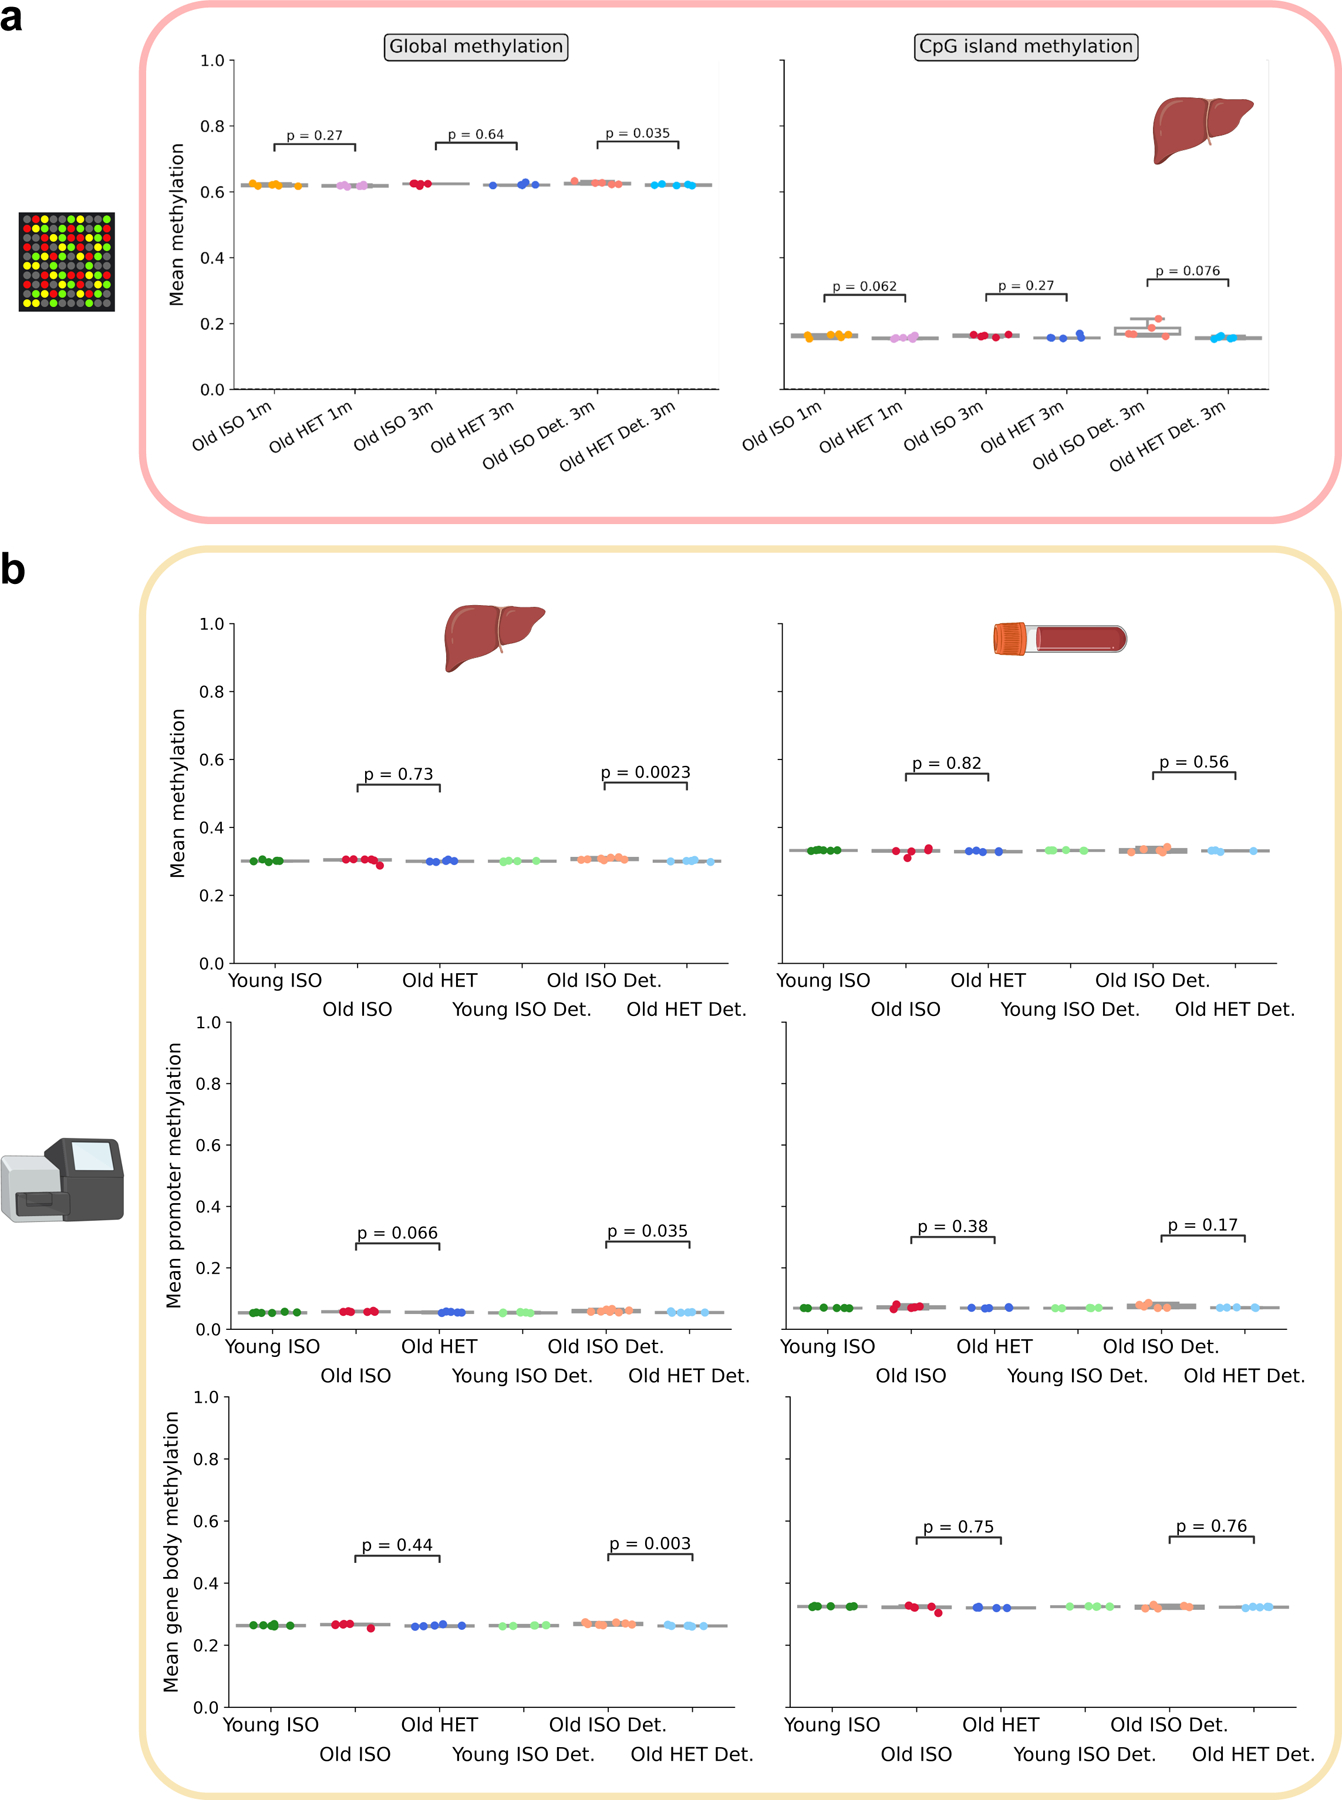
Extended Data Fig. 4. Mean methylation in array and RRBS methylation profiles.

a, Mean liver methylation assayed by the Mammalian Methylation Array (HorvathMammalMethylChip40), both based on all sites in the array (left) and only sites in CpG islands (right). n = 5 samples per group. b, Mean global methylation (top), promoter methylation (middle), and gene body methylation (bottom) of liver (left) and blood (right) RRBS samples. Mean methylation was assayed across 1,014,243 CpGs (top), 11,842 promoters (middle), and 13,811 gene bodies (bottom). n = 4–7 samples per group. Two-tailed Welch’s t-test were used for statistical analysis. Schematic tissues in each panel indicate the source of the sample.
