
Extended Data Fig. 7. Interactions between different omics modalities.
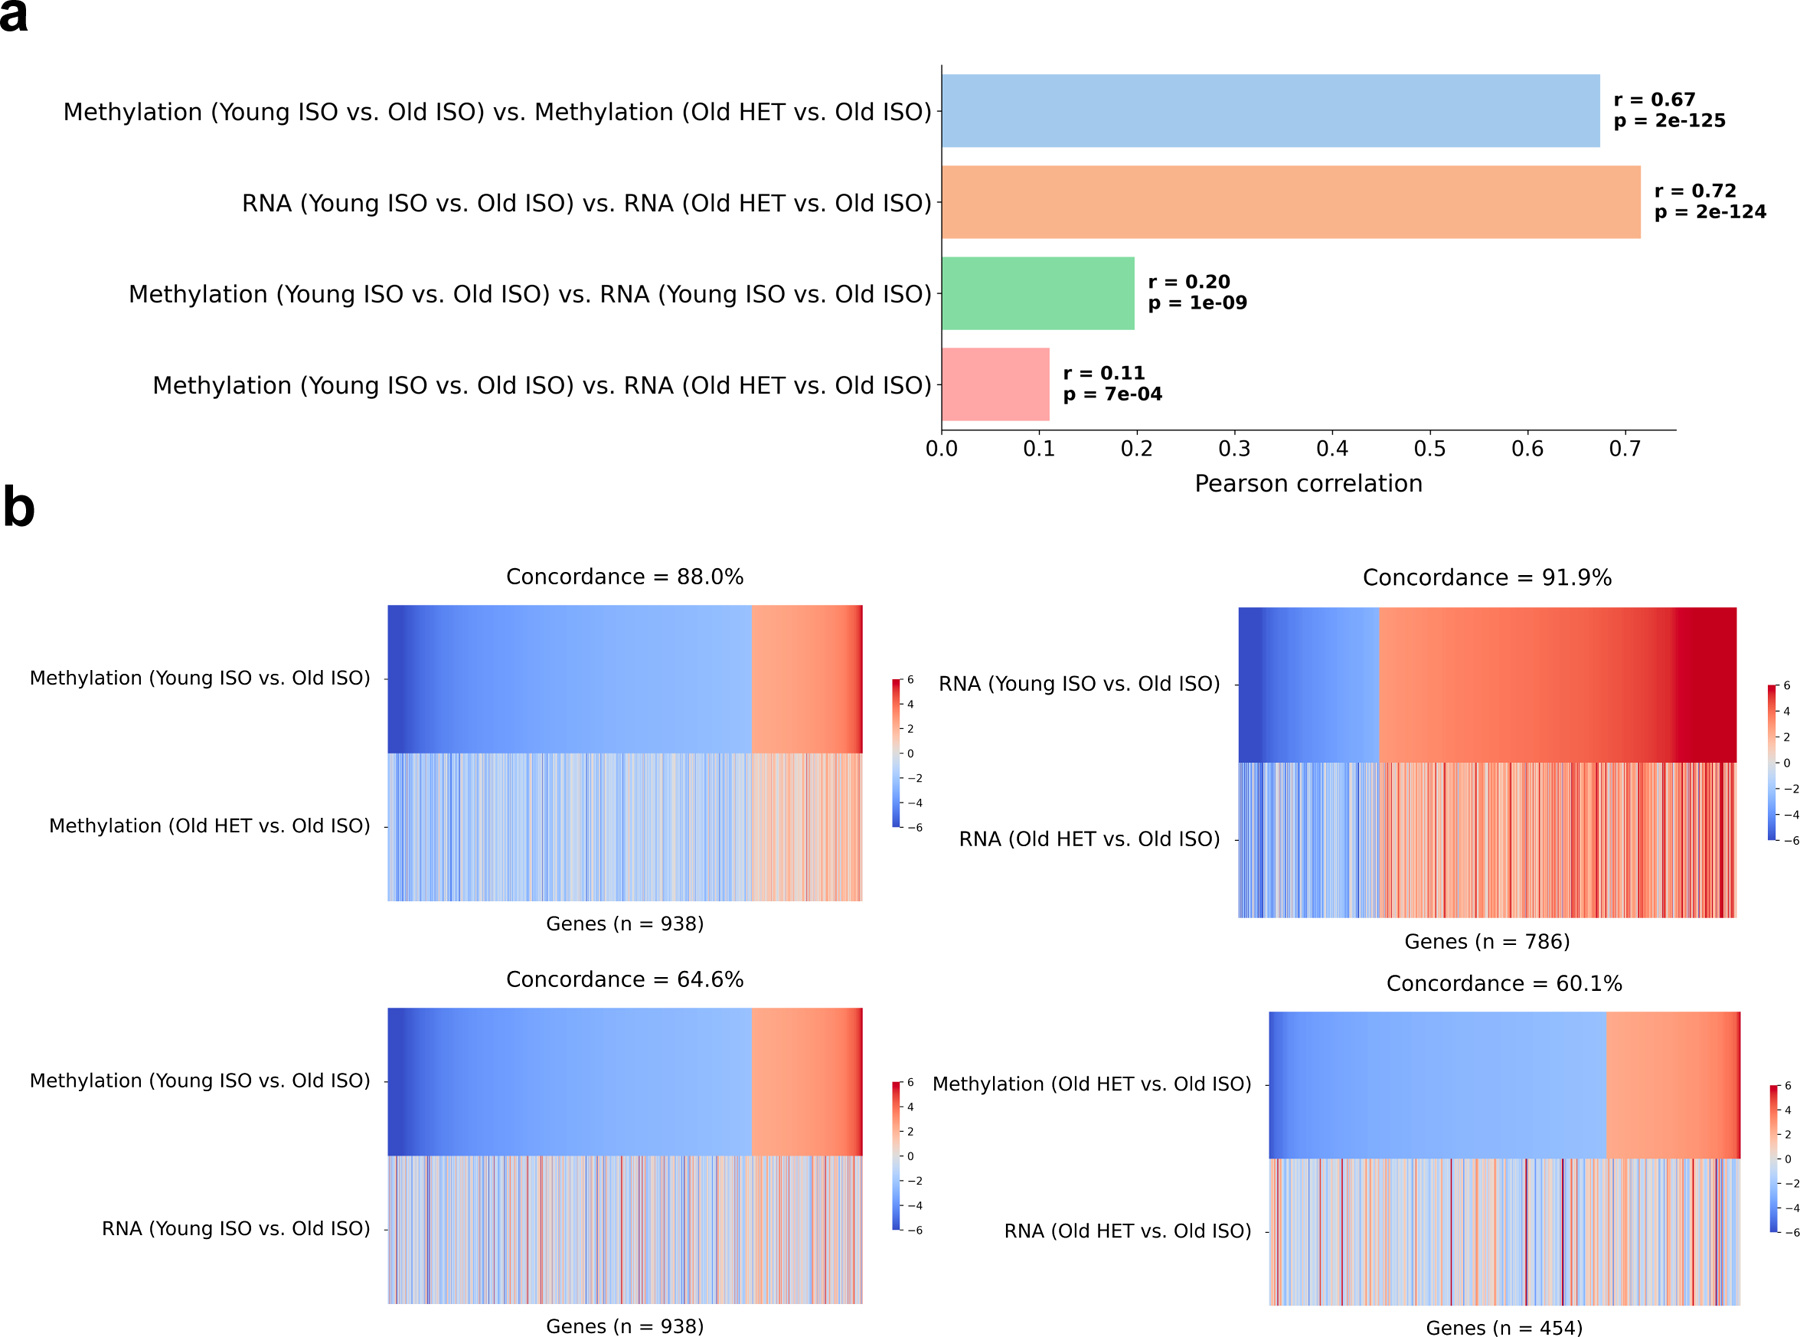
a, Correlation of changes across experimental groups and readout types. For each comparison in parentheses (i.e. Young ISO vs. Old ISO), a z-score was computed for either promoter methylation or gene expression. The Pearson correlation of these z-scores was then determined for genes passing a differential expression/methylation threshold of p < 0.05 for the first (left) group listed in each comparison. b, Heat maps highlighting the concordance of readouts and experimental groups. For each heat map, the z-score of genes that are significantly (p < 0.05) differentially expressed or methylated is shown. Genes are ordered by the z-score in the top group. Color bar on the right denotes z-score. The directional concordance, a measure of how directionally aligned the changes between the two readouts/groups are, is shown at the top of each heat map. 50% concordance represents random changes across groups.