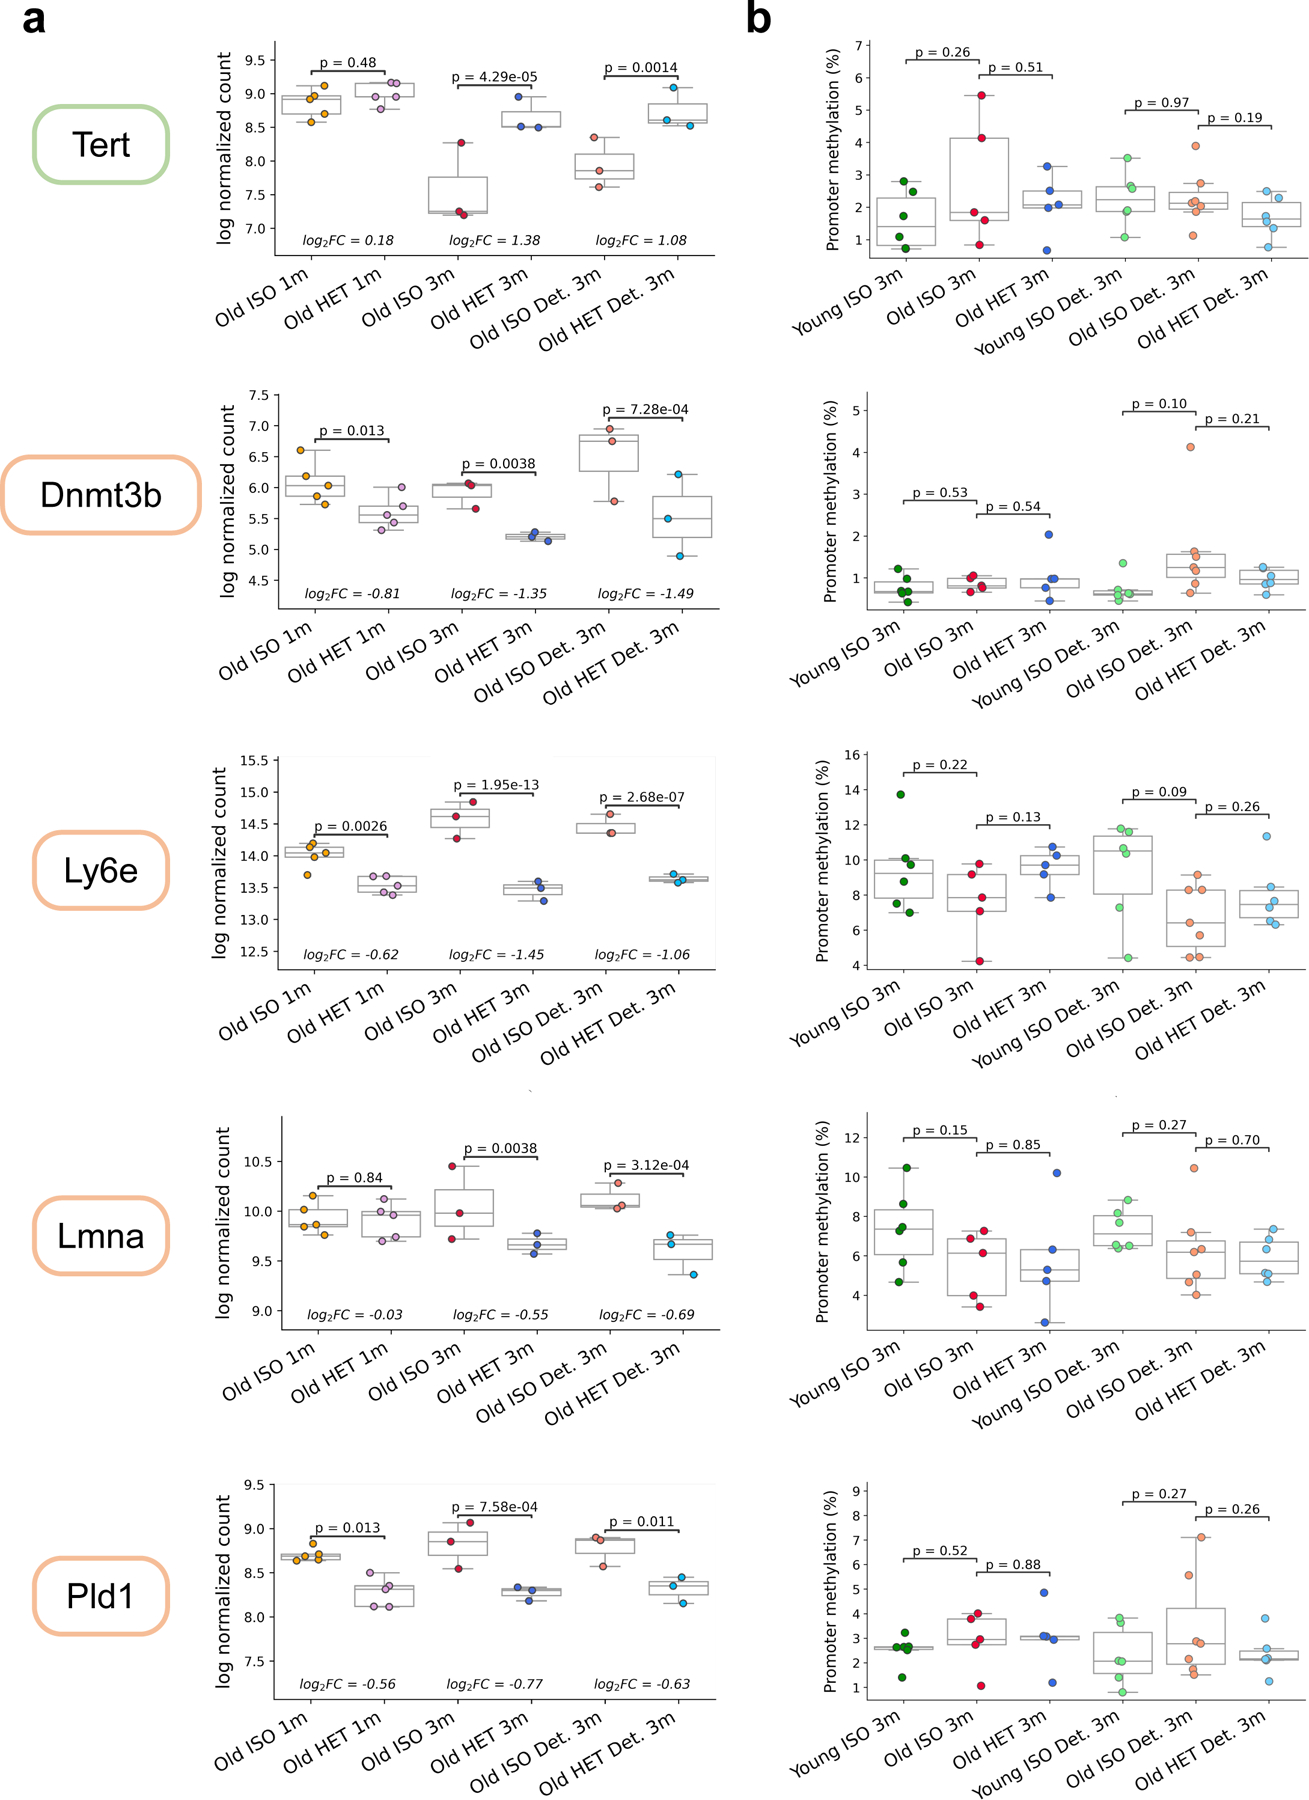
Extended Data Fig. 8. Transcriptomic and epigenetic changes resulting from HPB.

a, Boxplots of RLD-transformed, log-normalized counts of Tert, Dnmt3b, Ly6e, Lmna and Pld1 across 6 groups (from left to right: old short-term isochronic (n = 5), old short-term heterochronic (n = 5), old long-term isochronic (n = 3), old long-term heterochronic (n = 3), old long-term isochronic detached (n = 3), and old long-term heterochronic detached (n = 3). b, Mean promoter methylation of the genes mentioned in (a) across liver RRBS samples across 6 groups (from left to right: young long-term isochronic (n = 6), old long-term isochronic (n = 5), old long-term heterochronic (n = 5), young long-term isochronic detached (n = 6), old long-term isochronic detached (n = 7), and old long-term heterochronic detached (n = 6). Color of the box around each gene signifies directionality (green: gene expression increases in Old HET mice compared to ISO, orange: gene expression decreases in Old HET mice compared to ISO). Despite evident changes in expression patterns for these genes, no significant changes in promoter methylation are observed. N represents biological replicates for each group. P values determined by two-tailed Welch’s t-test. Box plots represent median, 25–75 percentile and 1.5x IQR.
