
Extended Data Fig. 9. SASP enrichment and differential expression across long-term and short-term HPB.
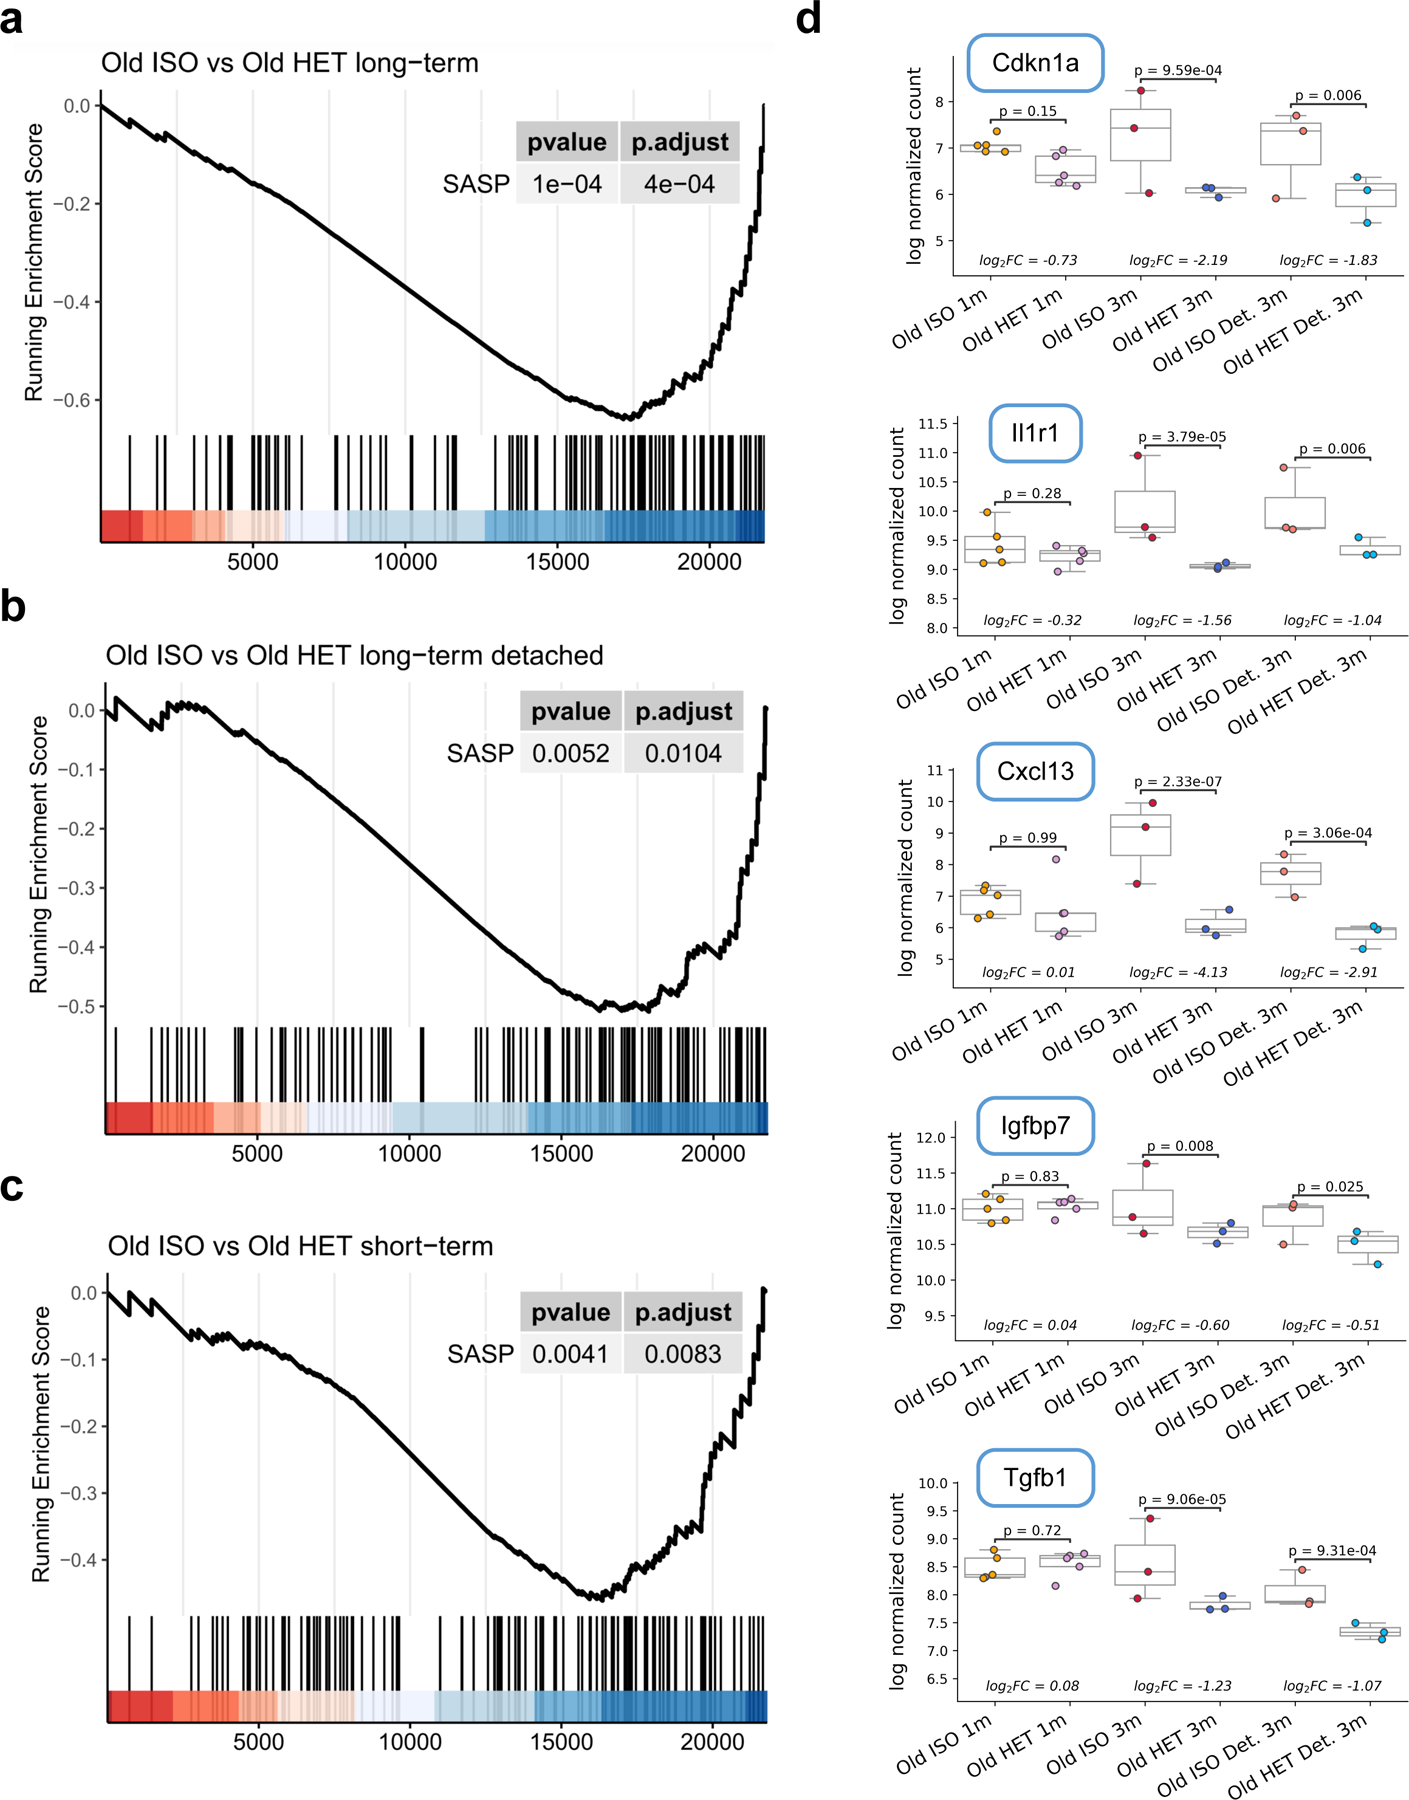
a-c, Running enrichment score for the senescence-associated secretory phenotype (SASP) gene set, comparing in (a) old isochronic and old heterochronic mice from the long-term HPB, in (b) old detached isochronic and old detached heterochronic mice from long-term HPB, and in (c) old detached isochronic and old detached heterochronic mice from short-term HPB. The P values for the gene set enrichment, along with the adjusted P value are shown in each panel. Positions of individual genes in the gene set are shown as black bars near the bottom of each panel. Long-term attached HPB shows the greatest negative enrichment for heterochronic samples, followed by detached long-term HPB and attached short-term HPB, respectively. d, Boxplots of RLD-transformed, log-normalized count of five SASP genes across 6 groups (from left to right: old short-term isochronic (n = 5), old short-term heterochronic (n = 5), old long-term isochronic (n = 3), old longterm heterochronic (n = 3), old long-term isochronic detached (n = 3), and old long-term heterochronic detached (n = 3). The log2 fold-change (log2FC) and associated P value are shown as calculated by two-tailed Welch’s test. Box plots represent median, 25–75 percentile and 1.5x IQR.