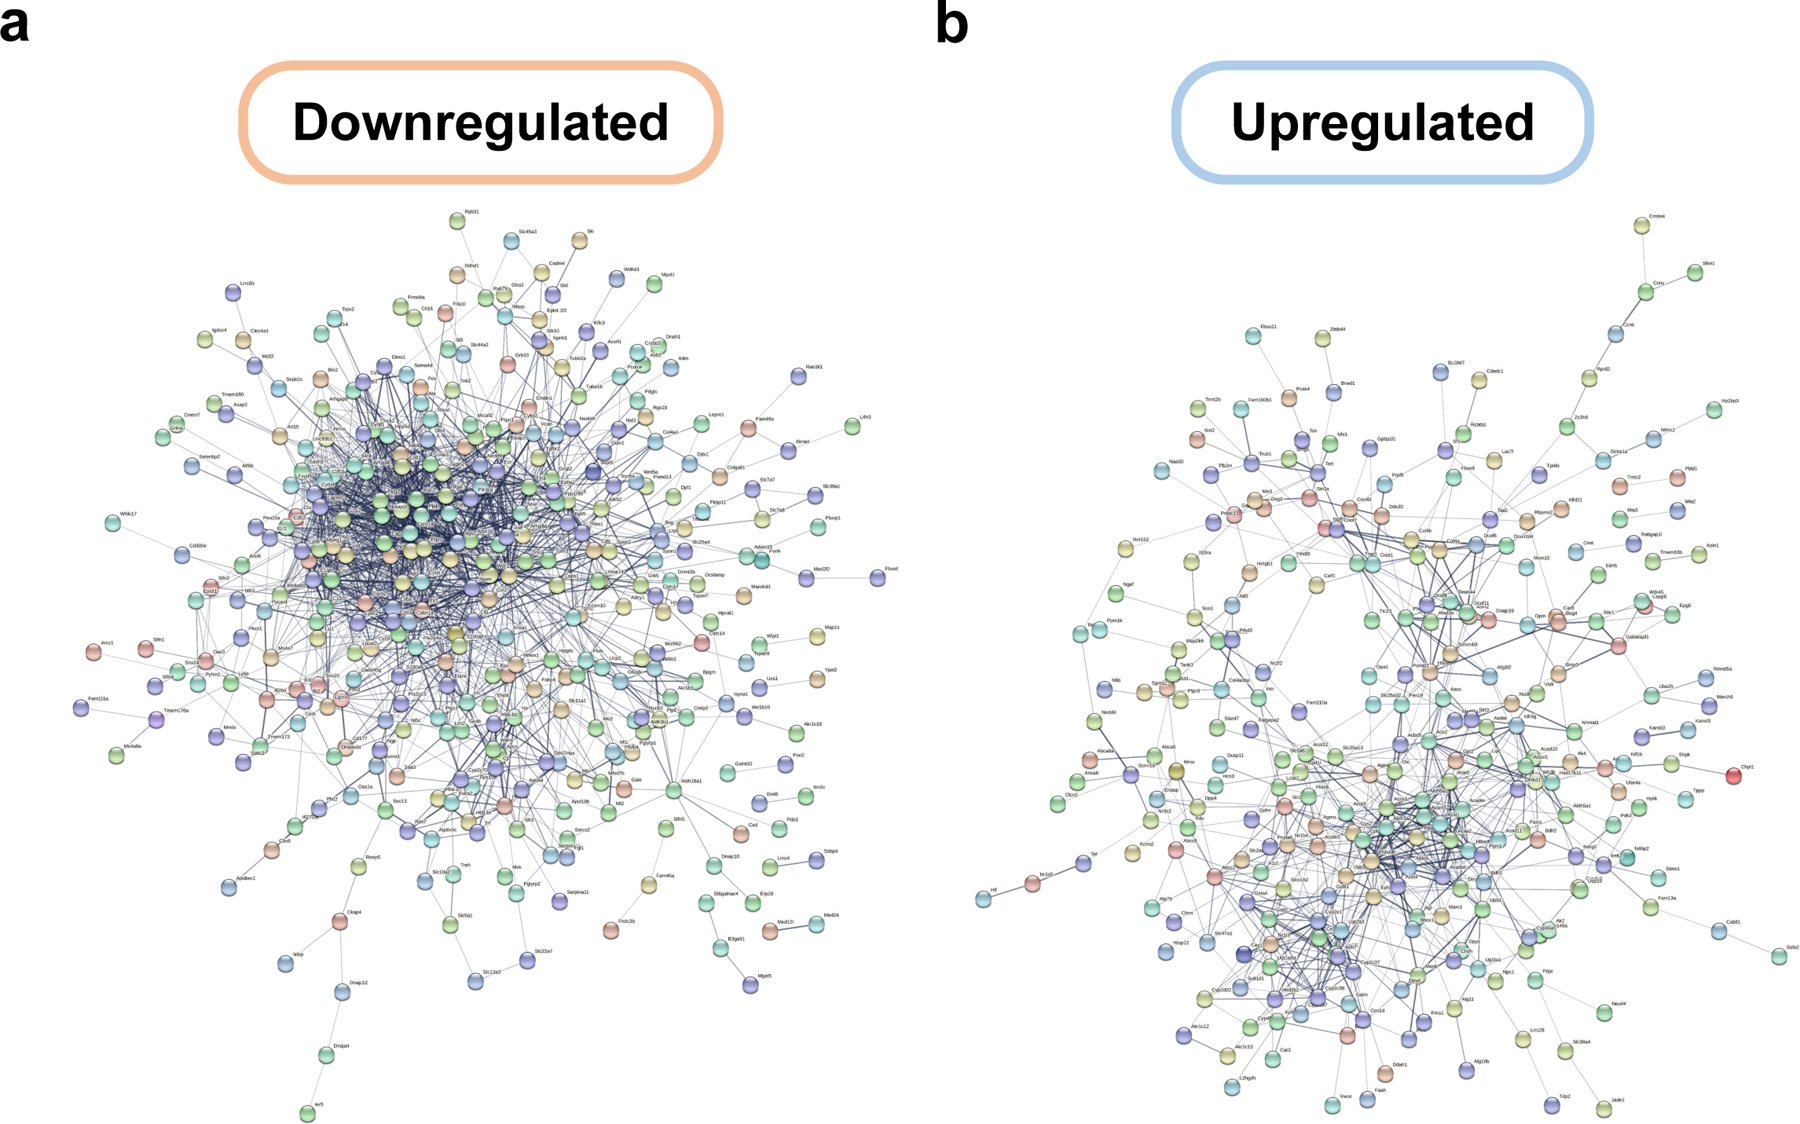
Extended Data Fig. 10. STRING network representation of significantly down- and upregulated genes.

a, STRING network representation of significantly downregulated genes in livers of old heterochronic mice (n = 421 genes) compared to isochronic mice immediately after detachment or after a 2-month detachment period (protein-protein interaction q-value < 1e-16). Genes were filtered based on directionality and absolute value of the log2FC. b, STRING network representation of significantly upregulated genes in livers of old heterochronic mice (n = 337 genes) compared to isochronic mice immediately after detachment or after a 2-month detachment period (protein-protein interaction q-value < 1e-16). Genes were filtered based on directionality and absolute value of the log2FC.
