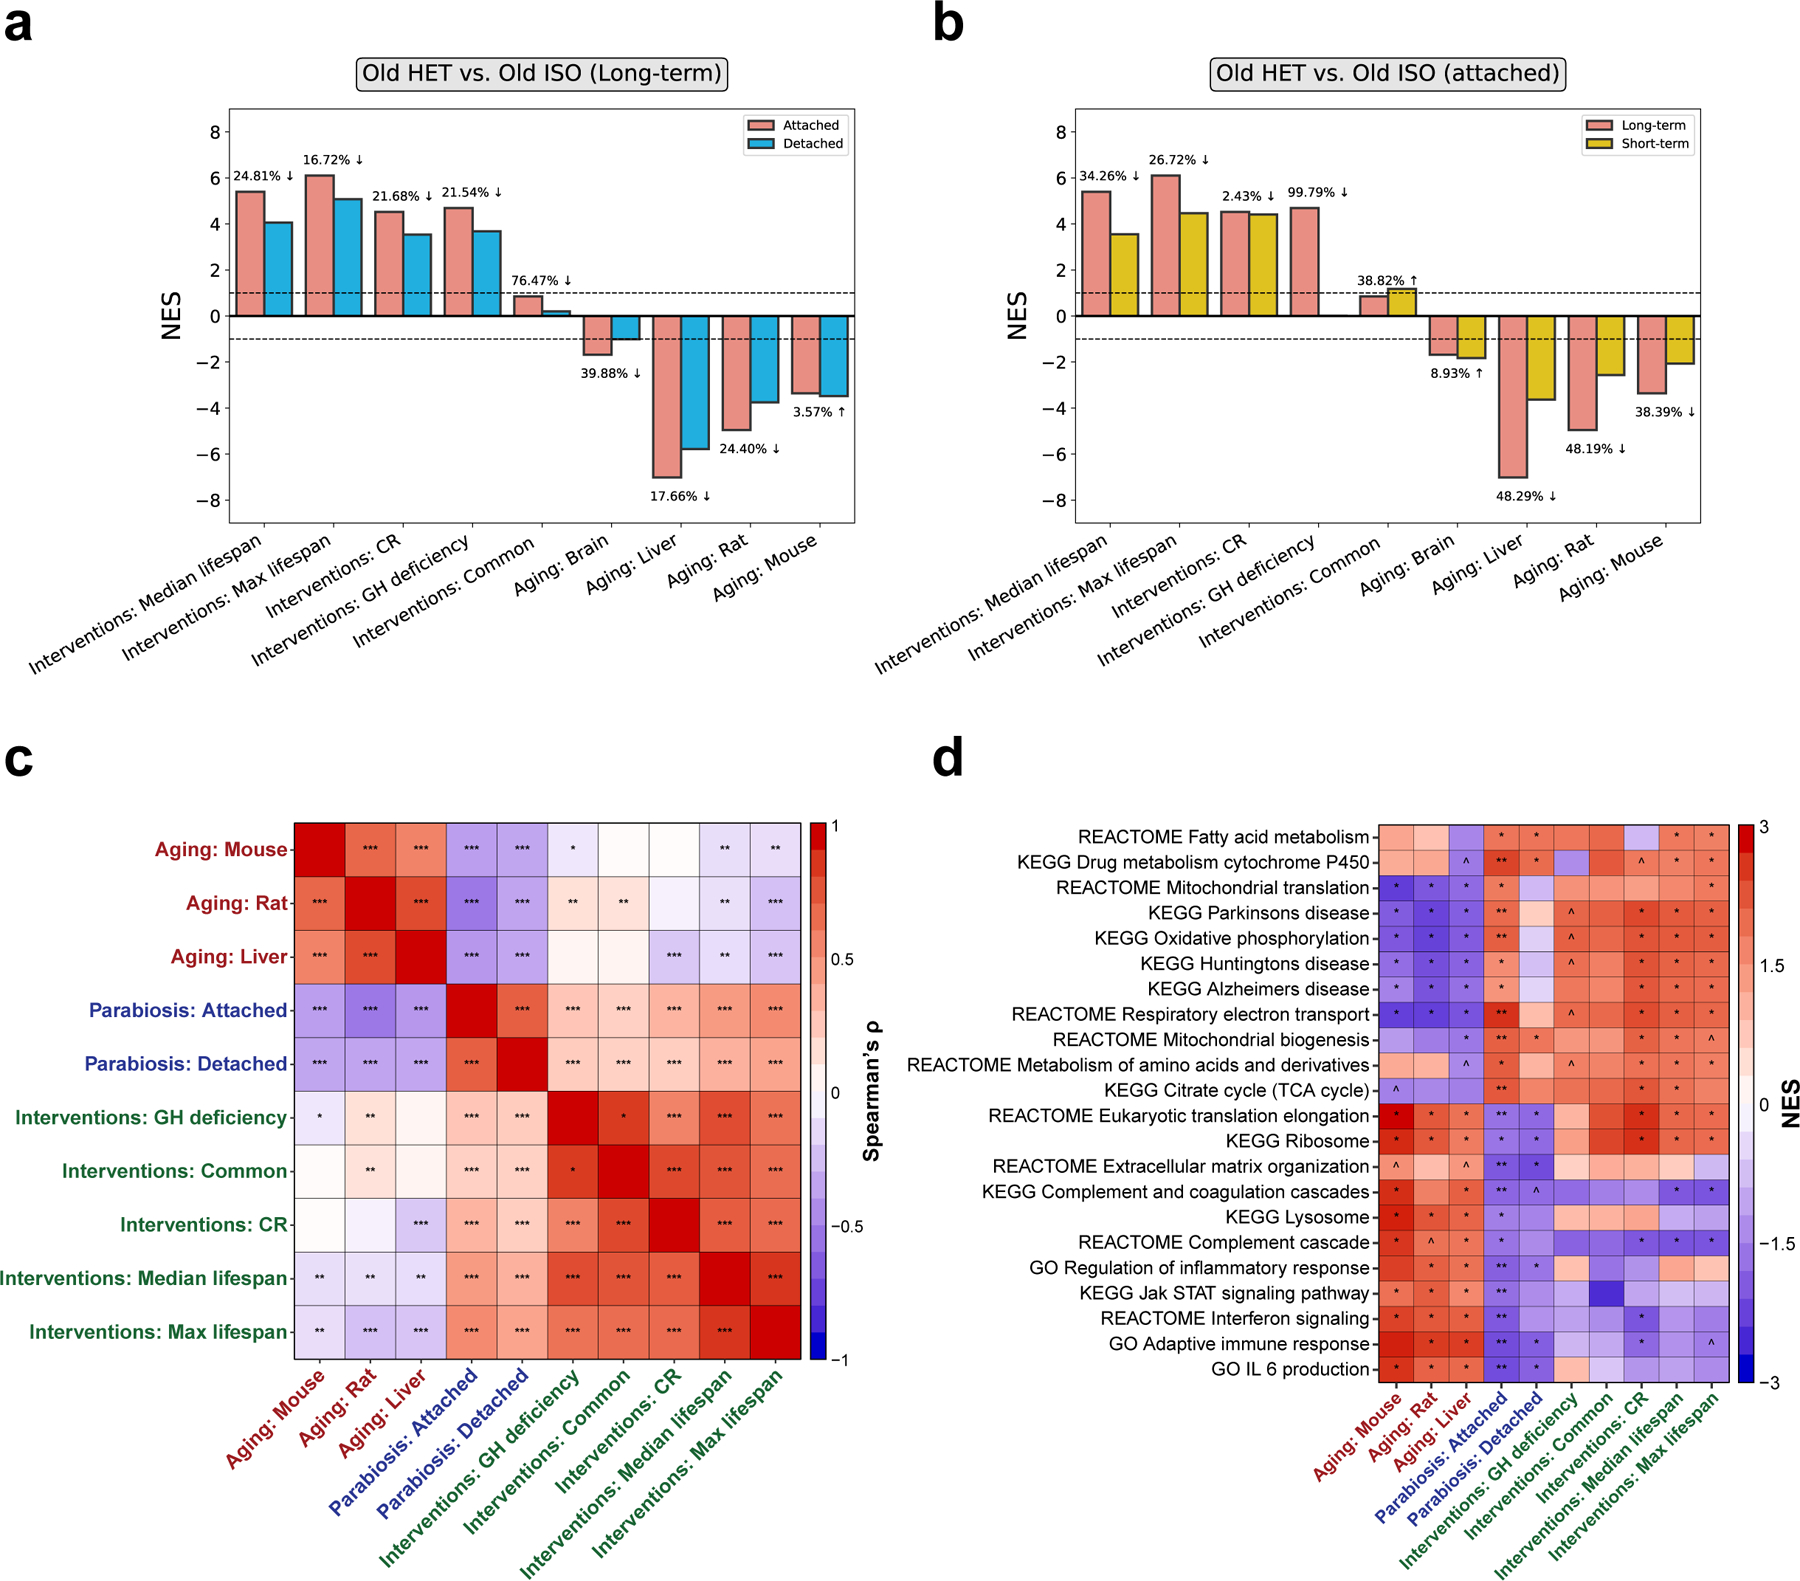
Fig. 6 |. The transcriptomic signatures of HPB align with longevity interventions and oppose aging.

a, Association between gene expression changes induced by long-term parabiosis with (blue) and without (red) a 2-month detachment period, and signatures of aging and life span extension. The latter include gene signatures of individual interventions (CR and GH deficiency), common intervention signatures (interventions: common) and signatures associated with an effect on life span (maximum and median life span). The percentage decrease comparing the attached and detached samples is shown for each pair of bars. b, Association between gene expression changes induced by long-term (red) and short-term (yellow) parabiosis without detachment and signatures of aging and life span extension. The signatures analyzed are the same as in a. c, Spearman correlation matrix of gene expression signatures associated with aging (red labels), life span extension (green labels) and HPB (blue labels). d, Functional enrichment analyses of gene expression signatures. Only functions significantly associated with at least one signature are shown. Cells are colored based on NES. The entire list of enriched functions is provided in Supplementary Table 5. P values were generated using GSEA. ^Padj < 0.1; *Padj < 0.05; **Padj < 0.01; ***Padj < 0.001.
