
Fig. 7 |. Gene expression analyses hint at putative rejuvenation mechanisms of long-term HPB.
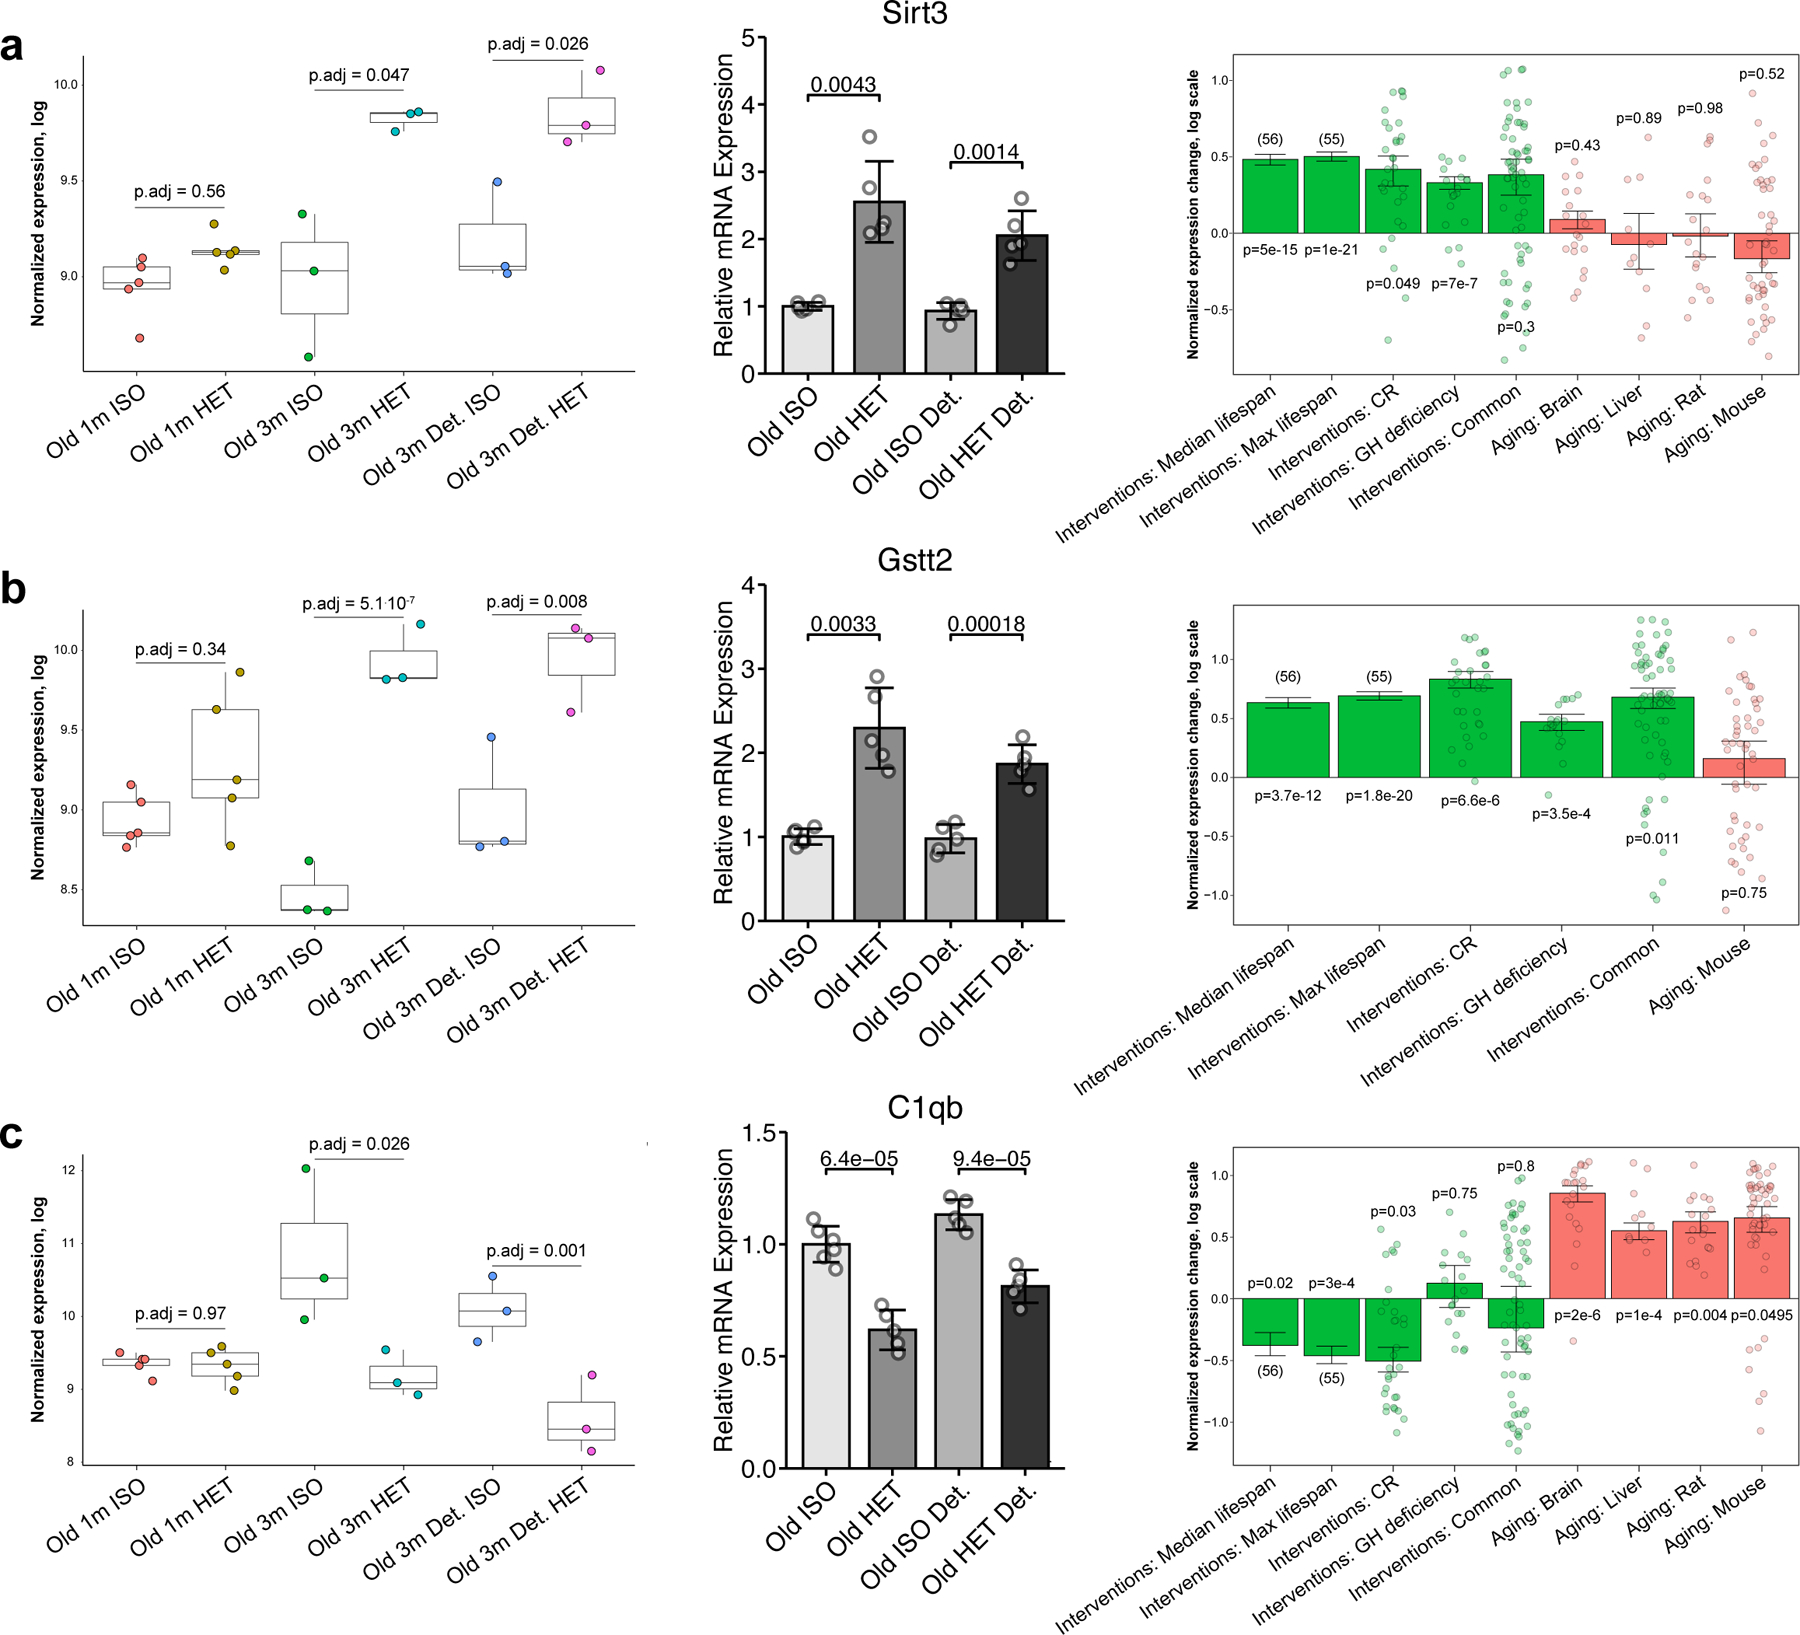
a–c, Expression of Sirt3 (a), Gstt2 (b) and C1qb (c) in mice subjected to parabiosis by RNA-seq analyses (left), RT–qPCR analyses (middle) and in response to established life span-extending interventions and aging (right). Left: for each gene, normalized expression in logarithmic scale is shown across different parabiosis groups: short-term isochronic (old 1 m ISO, n = 5) and heterochronic (old 1 m HET, n = 5) mice, long-term attached isochronic (old 3 m ISO, n = 3) and heterochronic mice (old 3 m HET, n = 3), long-term detached isochronic (old 3 m detached ISO, n = 3) and heterochronic mice (old 3 m detached HET, n = 3). Adjusted P values, indicating the difference in expression for each pair of isochronic and heterochronic mice, were calculated using a preplanned two-tailed Student’s t-test. The box plots represent the median, 25–75 percentiles and 1.5× IQR. Middle: for the RT–qPCR of each gene, each group has n = 5 biological replicates. The P value between connecting bars was calculated with a two-tailed Student’s t-test. Right: for every signature associated with life span-extending interventions (green) and aging (red), the means of the normalized log fold changes or slopes (for the signatures of the median and maximum life span) are presented. The error bars denote ± 1 s.e. Adjusted P values, indicating the difference of expression change from zero, were calculated with a mixed-effect linear model.