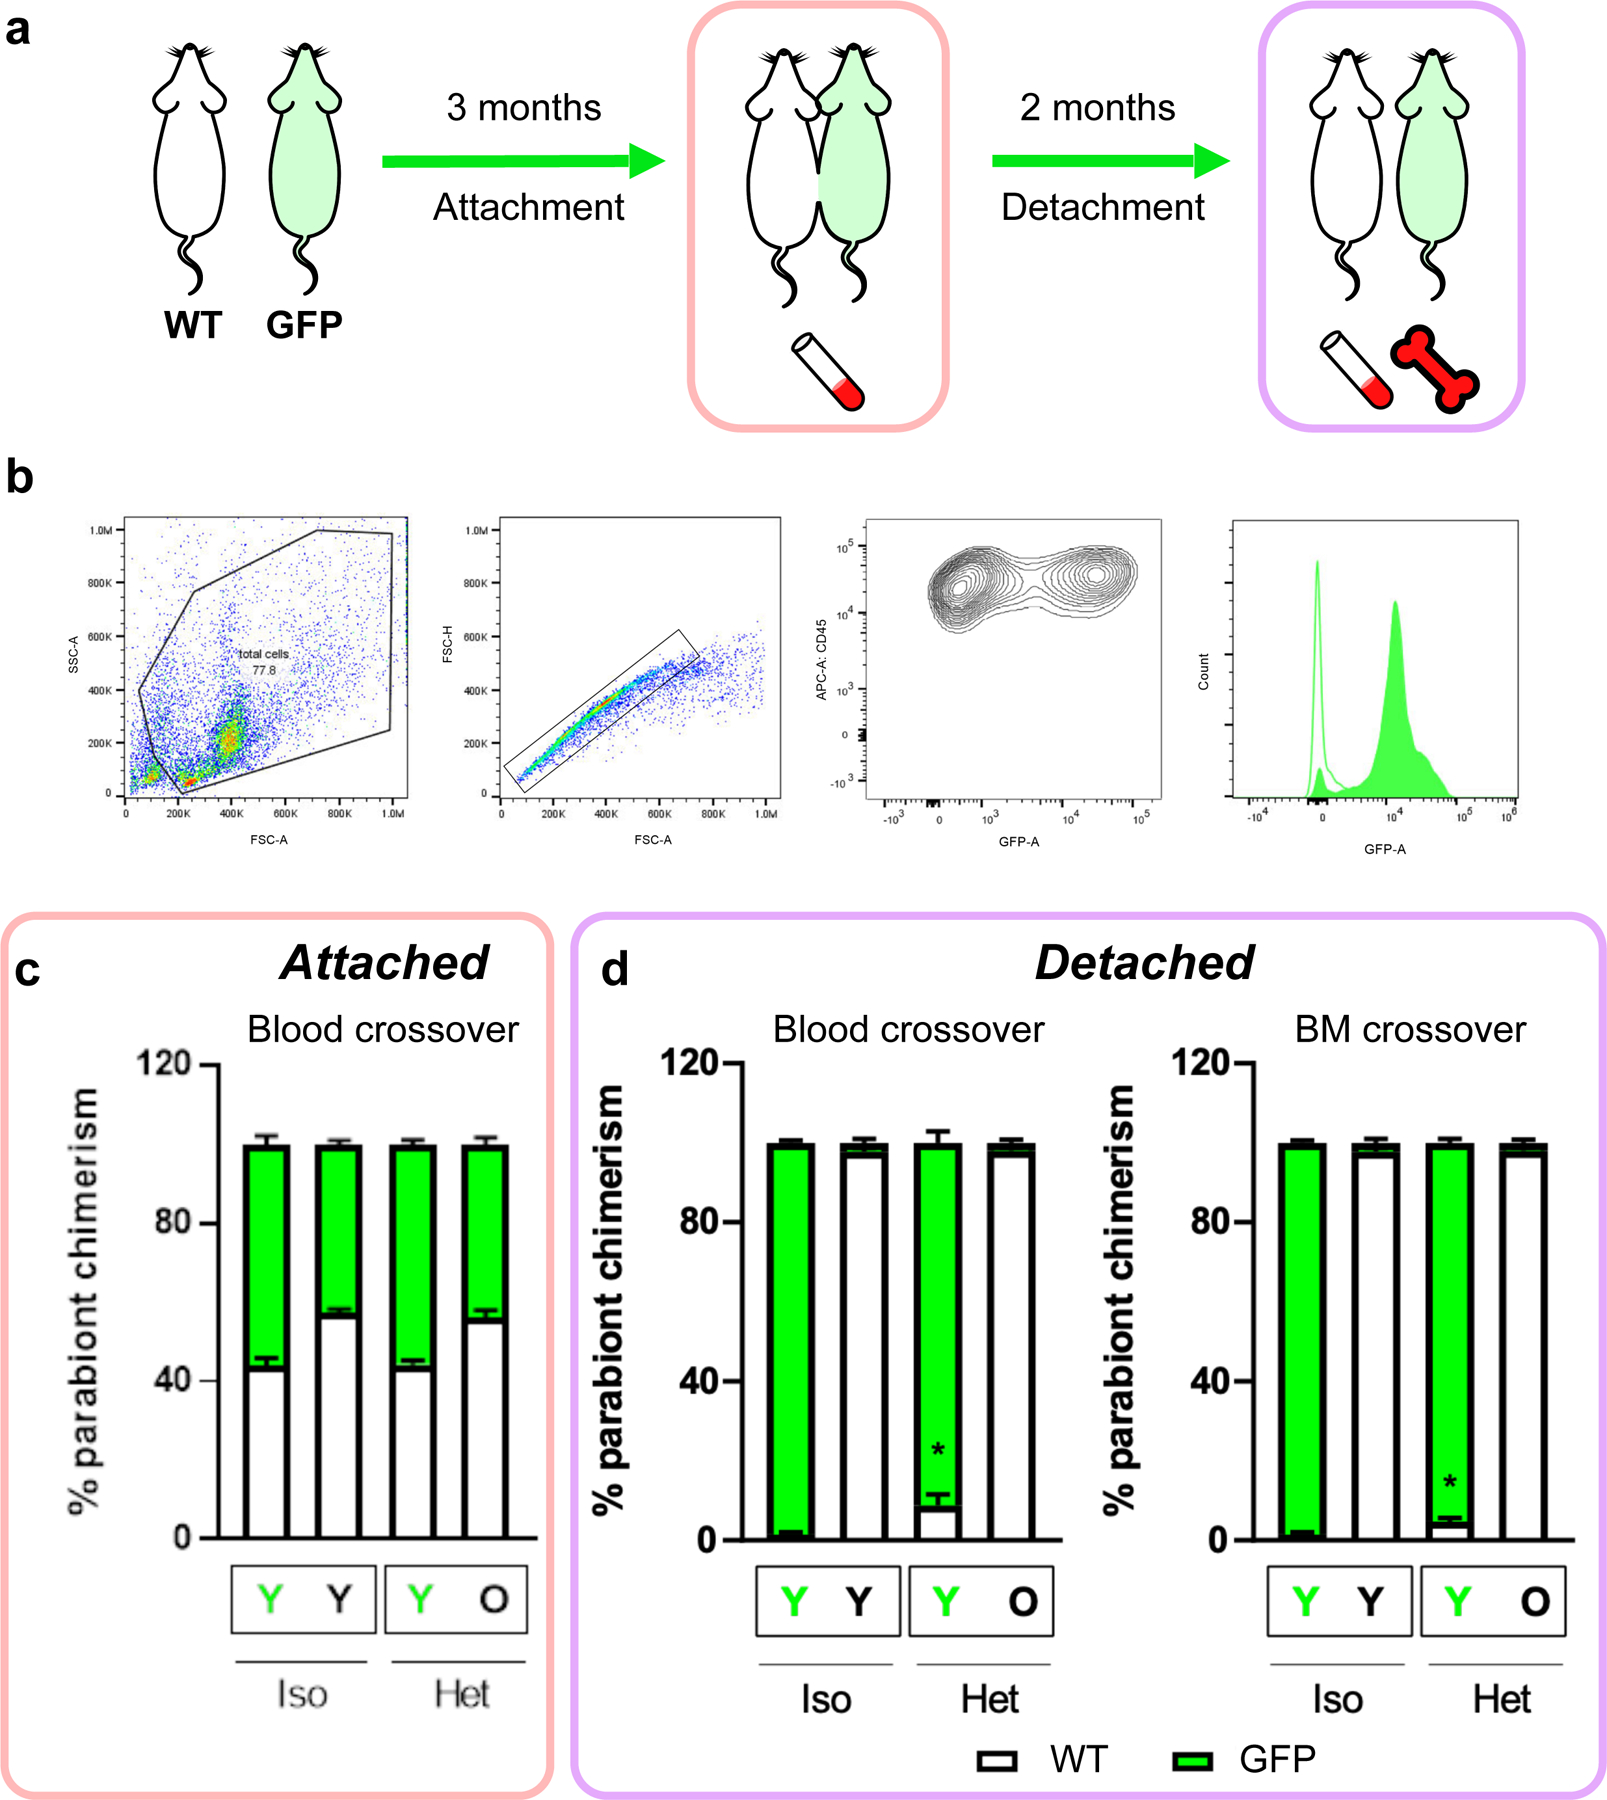
Extended Data Fig. 2: Blood mixture analyses after 3 months of parabiosis.

a, Schematic of experiments to analyze the blood chimerism after attachment and detachment. Green represents GFP (+) mice, white represents wild-type mice. b, Gating scheme applied to all downstream blood analysis between GFP and wild-type mice. Cells were ultimately gated on GFP (+) (x-axis) and CD45 (+) (y-axis) (right). c, Percentage of blood crossover during attachment. d, Percentage of blood (left) and bone marrow (BM, right) crossover after 2-month detachment, calculated as the % GFP (+) and (−) cells.
