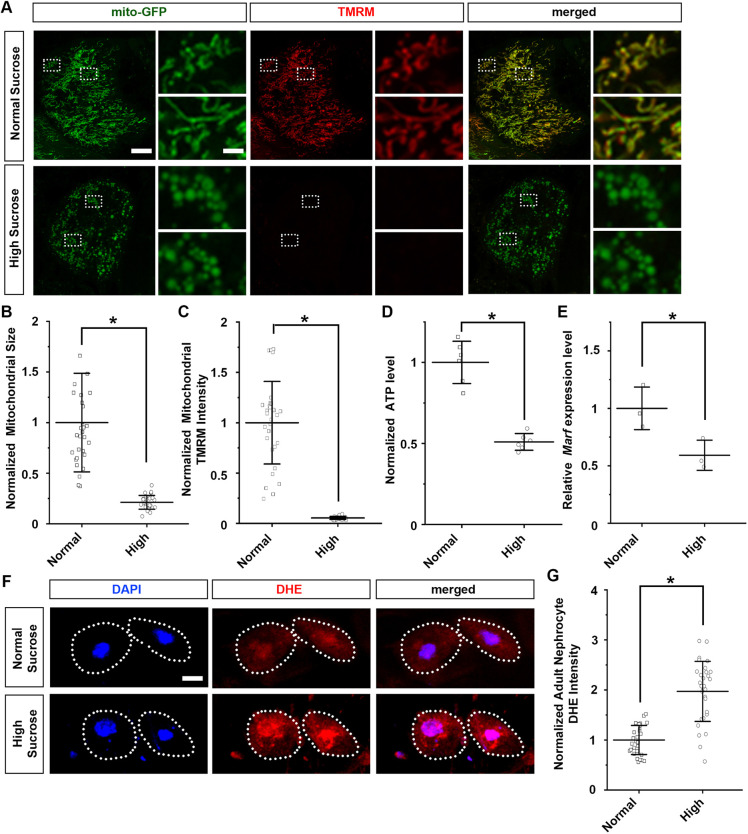
Fig. 2.
High-sucrose treatment causes mitochondrial dysfunction and increased levels of ROS. (A) Mitochondrial morphology in nephrocytes from normal diet and high-sucrose-treated flies. UAS-mito-GFP induced by nephrocyte-specific driver Dot-Gal4 labels the mitochondria (Dot>mito-GFP). Mitochondrial membrane potential was detected through TMRM fluorescence. Scale bars: 5 µm (left images); 1 µm (magnification of boxed area). (B) Quantification of mitochondrial size in nephrocytes from high-sucrose-treated flies relative to that in flies on a normal diet. n=size 30 mitochondria per nephrocyte averaged, for 30 nephrocytes from six flies per dietary group (4-day-old adult females; Dot>mito-GFP). Results show mean±s.d. normalized to the control group. *P<0.05 [Shapiro–Wilk test (α=0.05) indicated normal sucrose condition not normally distributed; Mann–Whitney U-test, P=3.3×10⁻¹¹]. (C) Quantification of mitochondrial TMRM fluorescence intensity in nephrocytes from high-sucrose-treated flies relative to that in flies on a normal diet. n=mitochondria in 30 nephrocytes from six flies per group (4-day-old adult females; Dot>mito-GFP). Results show mean±s.d. normalized to the control group. *P<0.05 [Shapiro–Wilk test (α=0.05) indicated normal distribution; two-tailed unpaired Student's t-test, P=3.71×10⁻¹³]. (D) Quantification of ATP level for high-sucrose-treated flies relative to that in flies on a normal diet. n=6 flies per group (4-day-old adult females; Dot>mito-GFP). Results show mean±s.d. normalized to the control group. *P<0.05 [Shapiro–Wilk test (α=0.05) indicated normal distribution; two-tailed unpaired Student's t-test, P=8.11×10⁻⁵]. (E) Quantification of Marf expression in nephrocytes for high-sucrose-treated flies relative to that in flies on a normal diet. n=50 adult flies per group (4-day-old adult females; Dot>mito-GFP); three biological repeats. Results show mean±s.d. normalized to the control group. *P<0.05 [Shapiro–Wilk test (α=0.05) indicated normal distribution; two-tailed unpaired Student's t-test, P=0.035]. (F) Levels of ROS in nephrocytes from normal diet and high-sucrose-treated flies. DAPI was used to visualize the nucleus. Dotted line indicates cell boundary. ROS levels were detected through DHE fluorescence (red). Scale bar: 5 µm. (G) Quantification of DHE fluorescent intensity in nephrocytes from high-sucrose-treated flies relative to that in flies on a normal diet. n=30 nephrocytes from six flies per group (4-day-old adult females; Dot>mito-GFP). Results show mean±s.d. normalized to the control group. *P<0.05 [Shapiro–Wilk test (α=0.05) indicated normal distribution; two-tailed unpaired Student's t-test, P=2.45×10⁻⁹].

