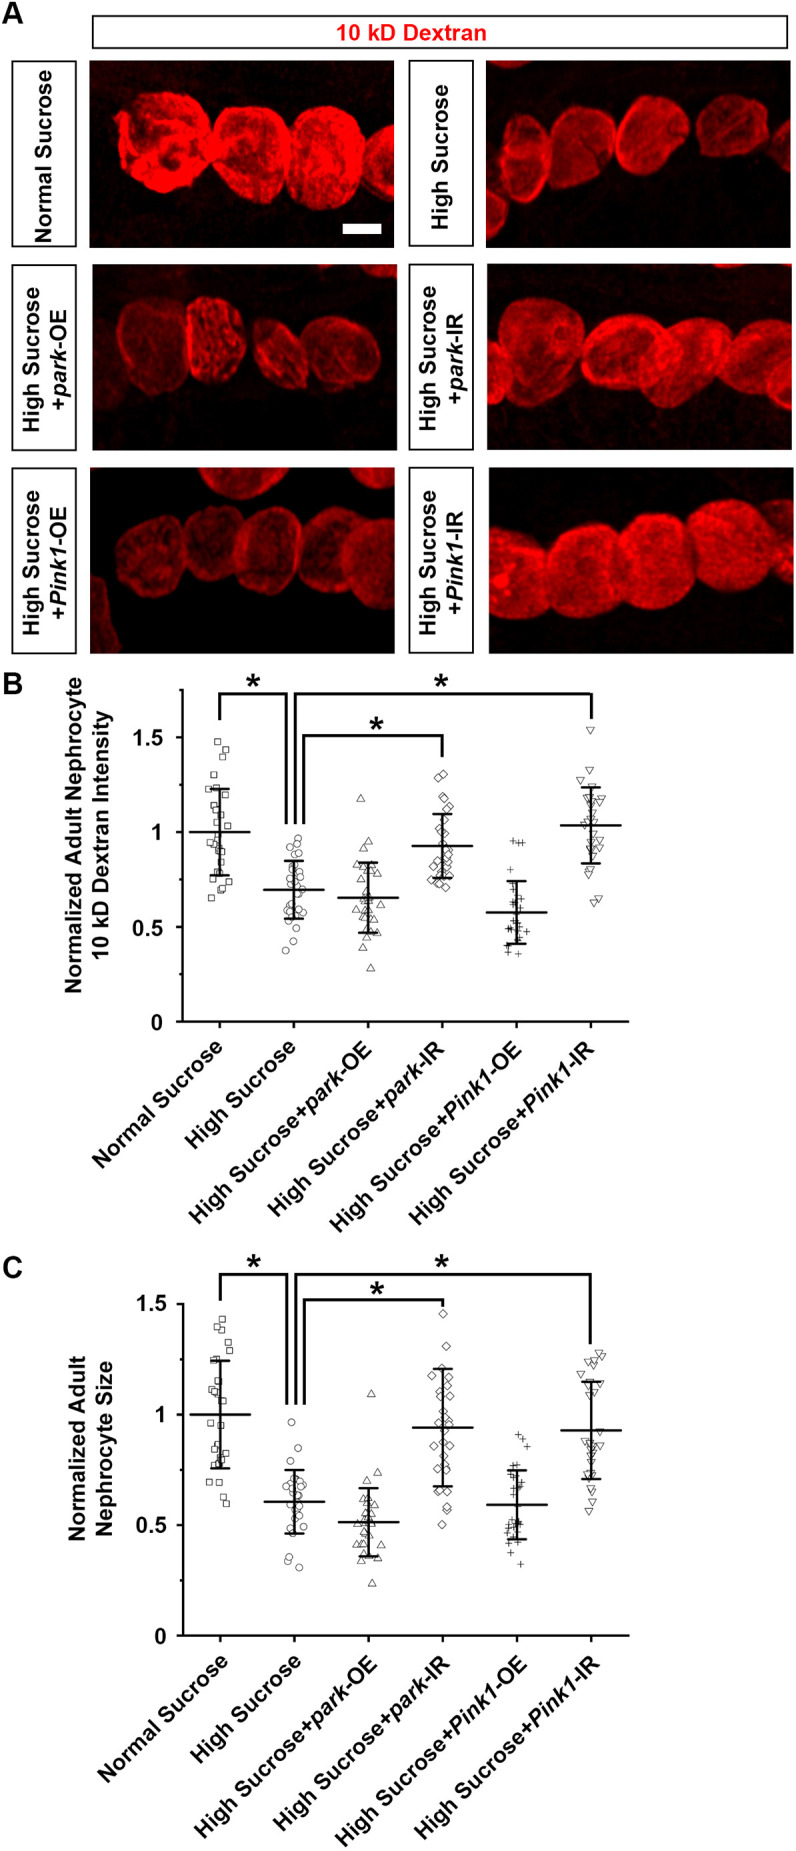
Fig. 5.

Pink1–Park pathway inhibition attenuates nephrocyte functional decline and cell size reduction. (A–C) Flies used (4-day-old adult females): control (Dot>mito-GFP); park-OE (Dot>mito-GFP,park-OE); park-IR (Dot>mito-GFP,park-RNAi); Pink1-OE (Dot>mito-GFP,Pink1-OE); Pink1-IR (Dot>mito-GFP,Pink1-RNAi). (A) 10 kDa dextran uptake (red) by nephrocytes from flies on a high-sucrose diet and a normal sucrose control. Scale bar: 25 µm. (B) Quantification of 10 kDa dextran uptake by nephrocytes. n=30 nephrocytes from six flies per group. Results show mean±s.d. normalized to the control group. *P<0.05 [Shapiro–Wilk test (α=0.05) indicated high-sucrose plus park-OE and high-sucrose plus Pink1-IR data were not normally distributed; Kruskal–Wallis H-test followed by Dunn's test; normal versus high, P=1.28×10⁻⁶; high versus high+park-IR, P=5.859×10⁻⁶; high versus high+Pink1-IR, P=4.686×10⁻⁸]. (C) Quantification of cell size for nephrocytes from flies on a high-sucrose diet and a normal sucrose control. n=30 nephrocytes from six flies per group. Results show mean±s.d. normalized to the control group. *P<0.05 [Shapiro–Wilk test (α=0.05) indicated high-sucrose plus park-OE and high-sucrose plus Pink1-IR data were not normally distributed; Kruskal–Wallis H-test followed by Dunn's test; normal versus high, P=1.429×10⁻⁸; high versus high+park-IR, P=8.841×10⁻⁷; high versus high+Pink1-IR, P=7.695×10⁻⁸].
