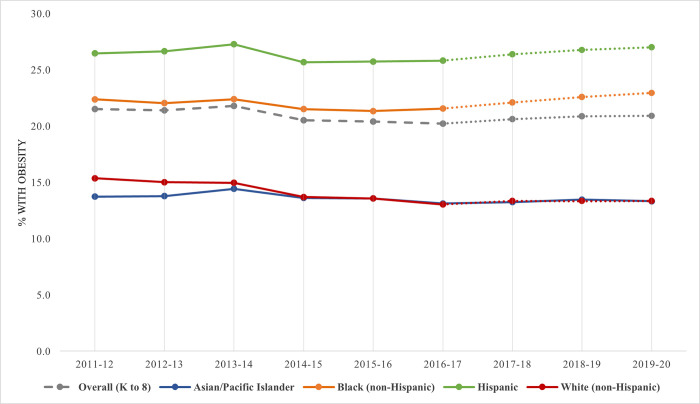
Fig 1. Obesity trends over time by race/ethnicity.
Adjusted binary logit models were built, including a linear term for time (index from 0–8 or 0–3), to assess whether trends in obesity and severe obesity prevalence were significant across school years 2011–12 to 2019–20 and 2016–17 to 2019–20. Models were run for all NYC public elementary and middle school students, which were significant at p<0.001 for both time periods, and were also run separately for each race/ethnicity subgroup (p<0.05 for all subgroups from 2011–12 to 2019–20 and p<0.01 for all except Asian/Pacific Islander students from 2016–17 to 2019–20, n.s.). Models were weighted and clustered by school and student.

