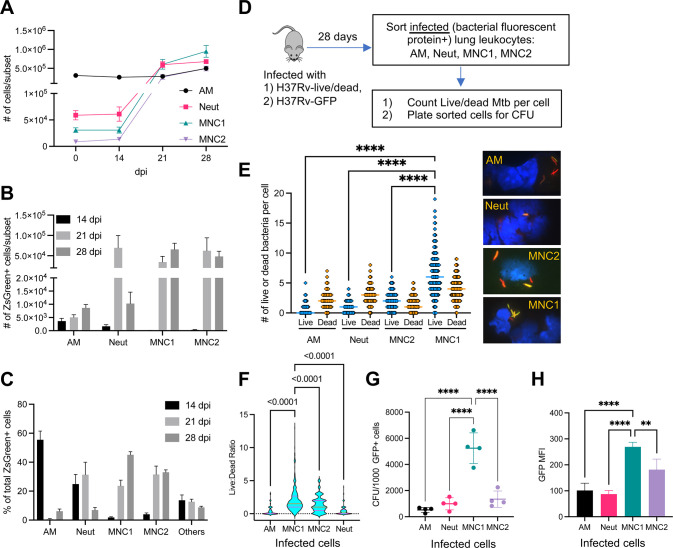
Fig 1. MNC1 are highly permissive for Mtb intracellular survival.
C57BL/6 mice were infected with the designated strain of Mtb by low-dose aerosol. Lung cells were isolated at the indicated time points post infection. (A) Lung phagocyte population dynamics after Mtb (H37Rv-ZsGreen) infection. Neutrophils (Neut), MNC1, and MNC2 increase in response to Mtb infection, while the number of alveolar macrophages (AM) changed minimally (n = 4–5). (B) Number of Mtb H37Rv-ZsGreen+ cells in distinct lung phagocyte subsets by flow cytometry (n = 4–5). (C) Cell type composition of total Mtb H37Rv-ZsGreen+ lung leukocytes by flow cytometry. After early predominant distribution of Mtb in AM and neutrophils, MNC1 and MNC2 dominate by 28 dpi (n = 4–5). (D) Schematic diagram of procedures to quantitate intracellular live Mtb in sorted lung phagocyte subsets. C57BL/6 mice (n = 10) were infected with Mtb H37Rv-live/dead or H37Rv-GFP and cells containing fluorescent protein-expressing bacteria were analyzed at 28 dpi. (E) MNC1 contain the largest number of live Mtb per cell 28 dpi. Quantitation of live (GFP+mCherry+) or dead (GFP-mCherry+) Mtb per infected cell (n ≥ 300) was performed by fluorescence microscopy on viable cells sorted from mice infected with Mtb H37Rv-live/dead. Representative images on the right show live and dead Mtb. Dead (mCherry+GFP-) Mtb are red; live (mCherry+GFP+) appear yellow. The majority of the Mtb in AM and neutrophils are dead, while the majority of the bacteria in MNC1 and MNC2 are live (MNC1>MNC2). Images were taken using a 63x oil objective. (F) The ratio of live to dead bacteria in individual cells was calculated from the raw data used for Fig 1E. The orange horizontal bar indicates the median and the pink horizontal bars indicate the 25th and 75th percentiles. Statistical comparisons used the Kruskal-Wallis test with Dunn’s multiple comparisons test. (G) MNC1 contain the largest number of live Mtb (H37Rv-GFP) at 28 dpi. Cells in each subset were sorted according to surface phenotypes and for bacterial status (GFP+). CFU of sorted GFP+ cells in each subset were counted after 3 wk of incubation. The results are expressed as CFU per 1000 GFP+ cells in each subset. (H) GFP MFI correlates with live Mtb burdens in the 4 infected lung myeloid cell subsets from mice infected with H37Rv-GFP (28 dpi). Results are presented as mean ± SD. Representative data from two independent experiments are shown for (A-C, G-H). **p<0.01 ****p<0.0001 by one-way ANOVA for (E, G, H).

