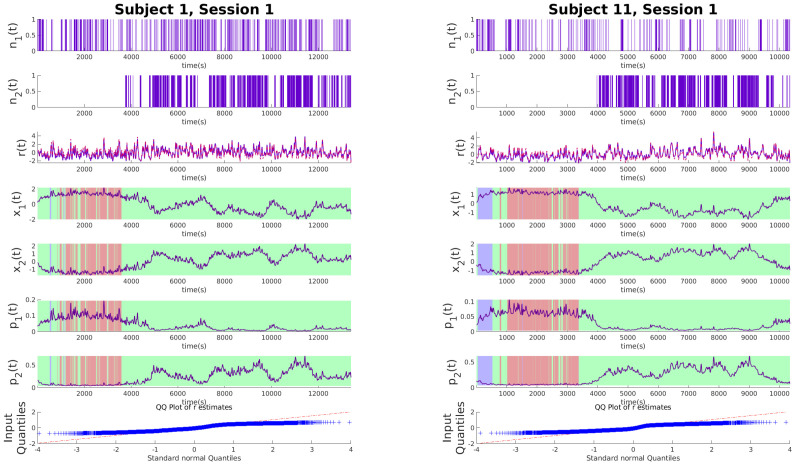
Fig 2. Latent state estimations for experimental data with no stressors.
Each of the panels above shows the experimental data for no-stressor sessions. From the top, the binary variables n1 and n2 derived from deconvolved EDA data and typing data respectively, the continuous variable r denoting the RR intervals derived from heart rate (red line) and estimated x1 and x2 (purple line) x1 and x2 in order from top indicating cognitive arousal state and expressive typing state respectively. p1 and p2 show the estimated probabilities. Patches of green, red, and cyan indicate what application the subject was using at the time of measurement. Green indicates applications for information search like internet explorer, red is for typing like Microsoft word and PowerPoint, and cyan is for when subjects are looking at their emails. Finally, the QQ plot for the residual error of r is shown. The panel on the left is for subject 1 and the one on the right is for subject 11.

