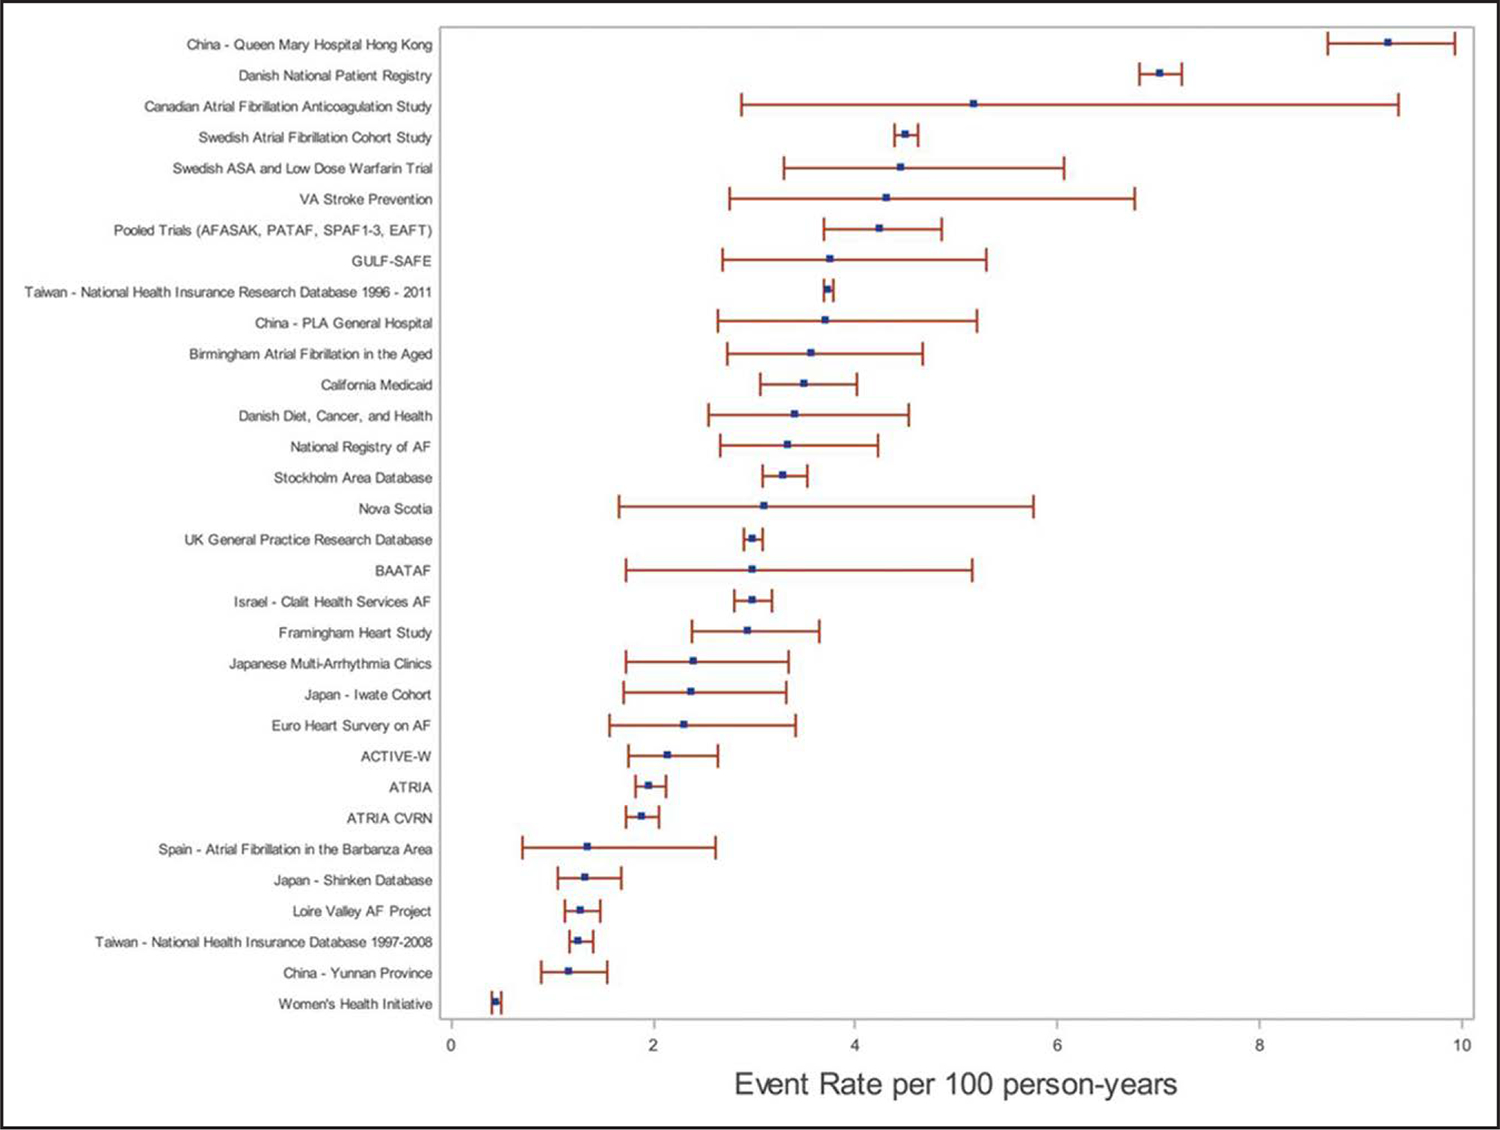
Figure 9. Rates of Stroke by Stroke Risk Score Levels in Different Cohorts.

Overall stroke rate in atrial fibrillation cohorts in order of descending stroke rate (events per 100 person-years). Reproduced with permission from Quinn et al.4 Copyright 2017 American Heart Association, Inc.
