
FIG 3.
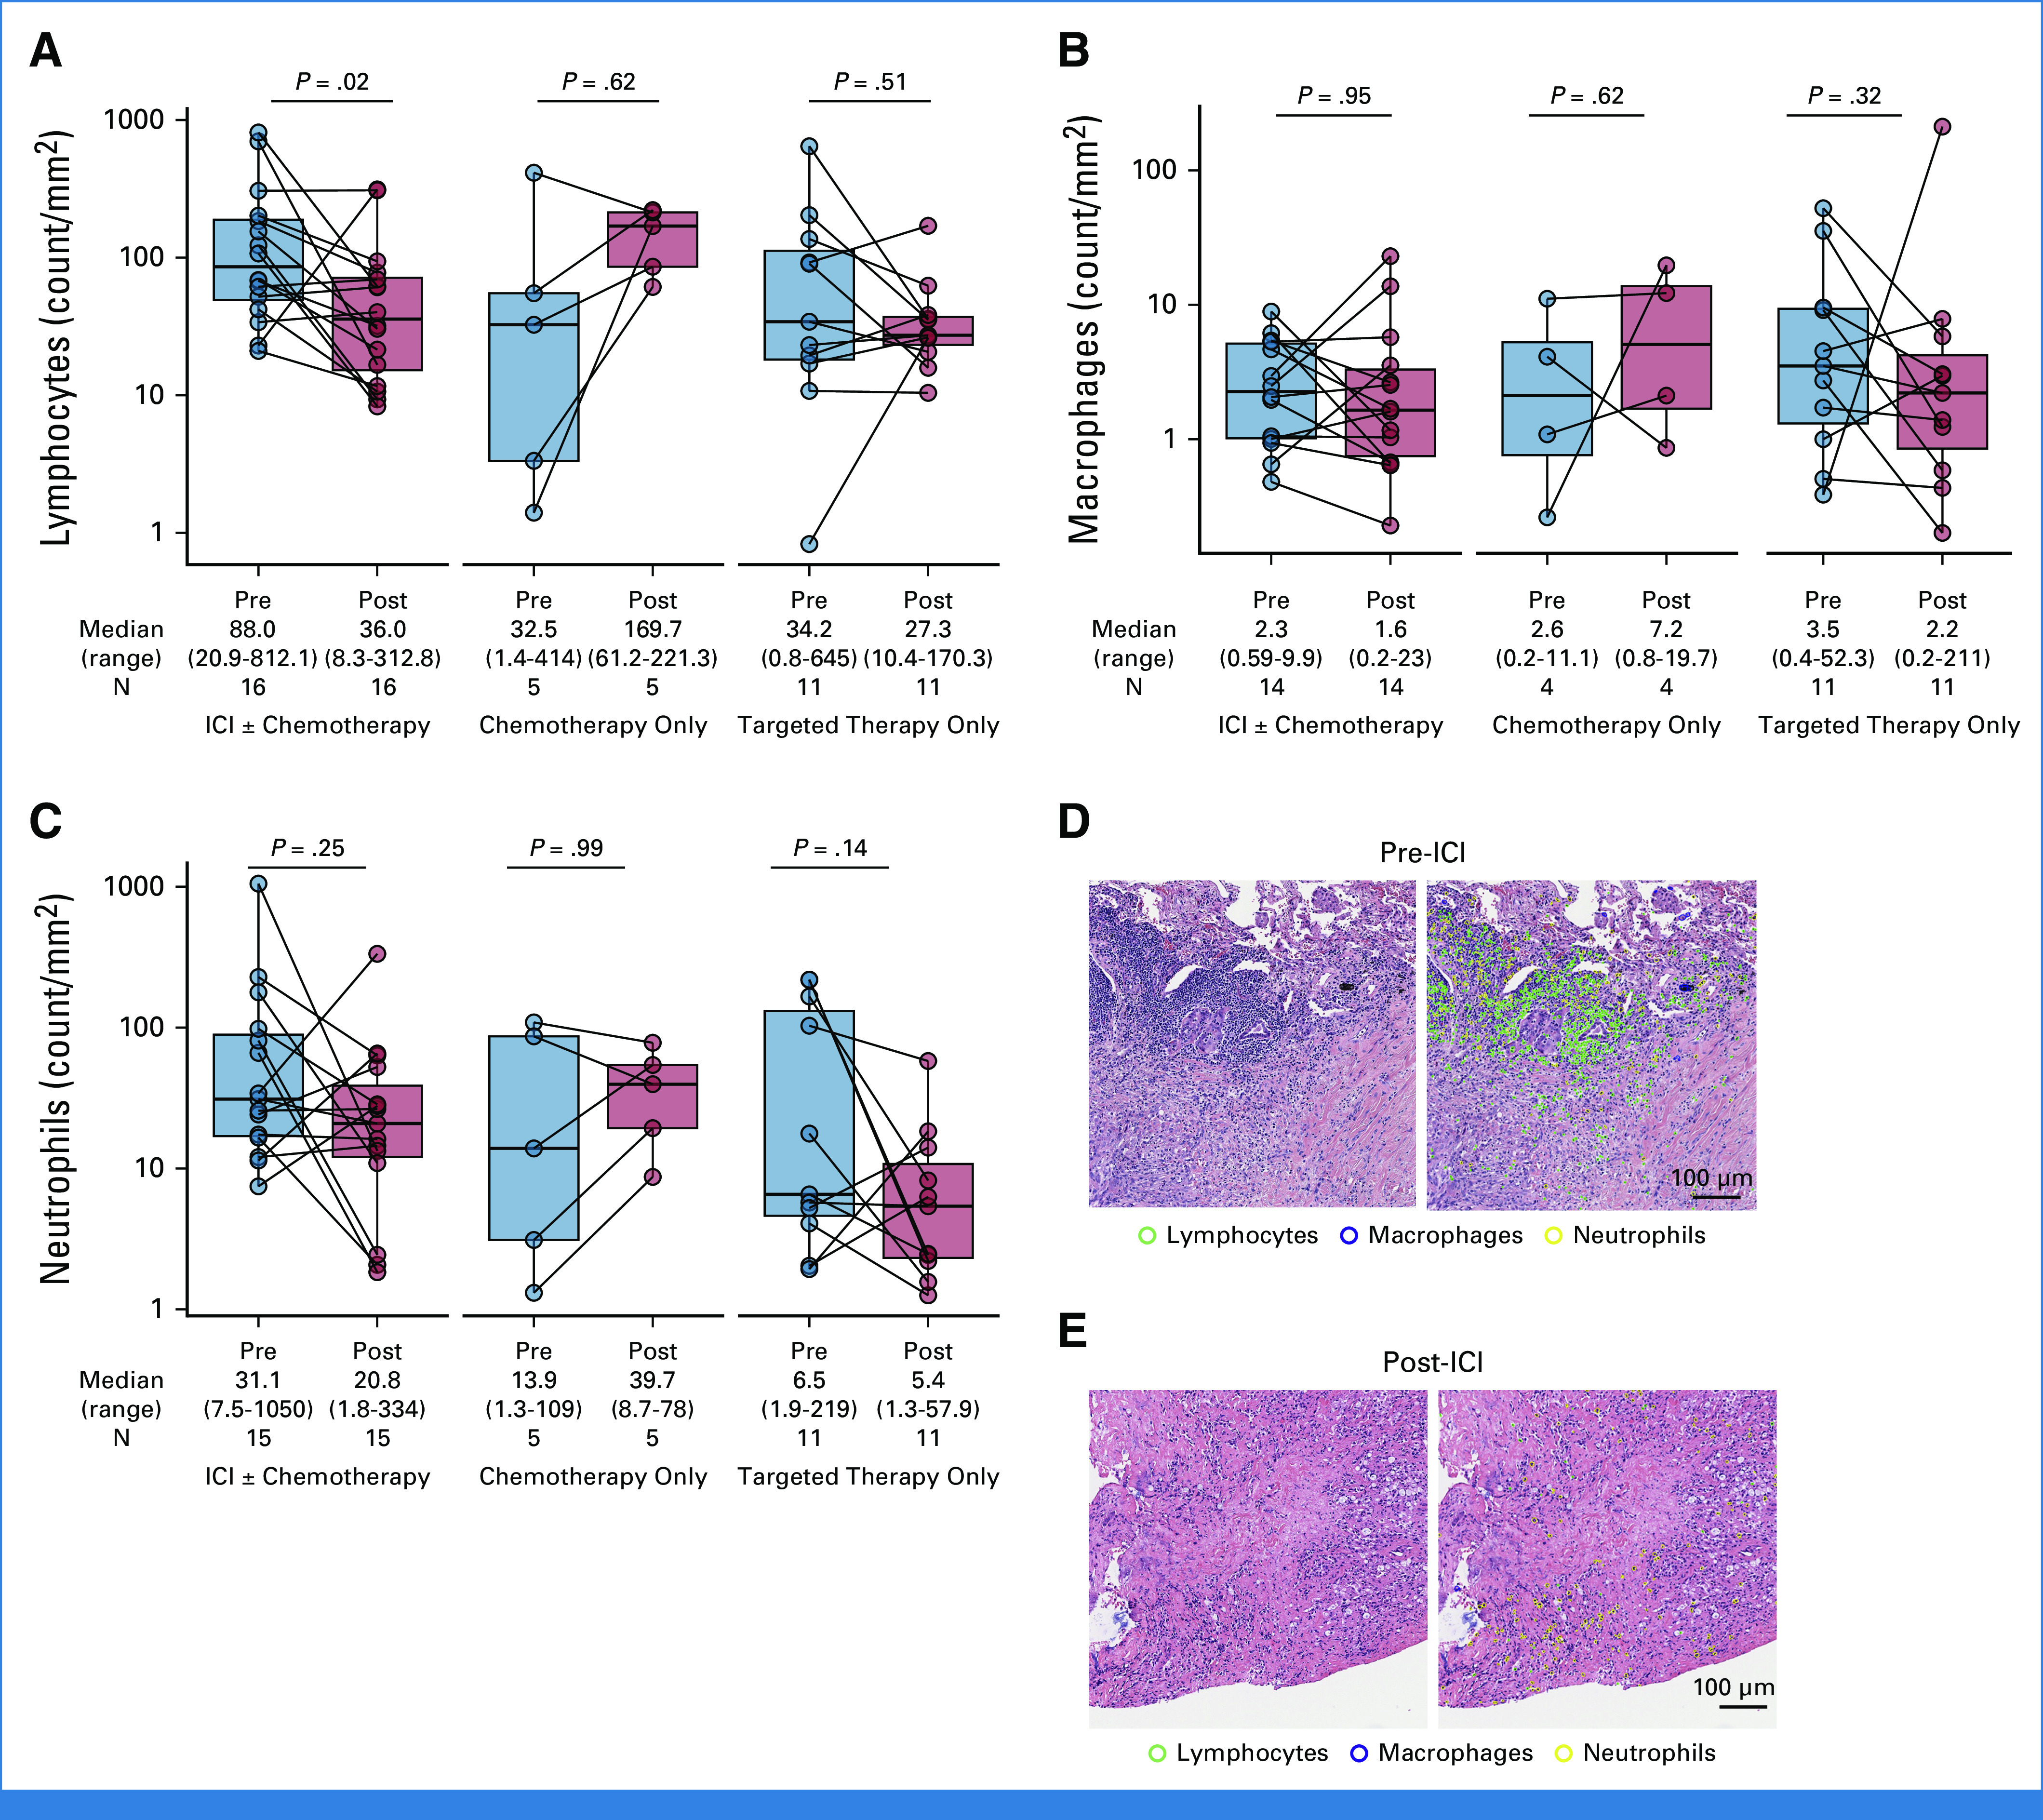
Paired box plots showing the change in the density of tumor-infiltrating (A) lymphocytes, (B) macrophages, and (C) neutrophils among patients with matched H&E-stained slides before versus after intervening immunotherapy, chemotherapy, or targeted therapy. Immune cell density was quantified on digital pathology imaging using the validated machine learning algorithm PathML. Representative images of (D) a pre-ICI sample and (E) a matched postimmunotherapy tumor sample that underwent immune cell subset deconvolution using PathML are shown, reflecting a significant decrease in intratumoral lymphocytes in the immunotherapy resistant sample. Groups were compared using the paired Wilcoxon signed-rank test. H&E, hematoxylin and eosin; ICI, immune checkpoint inhibitor.