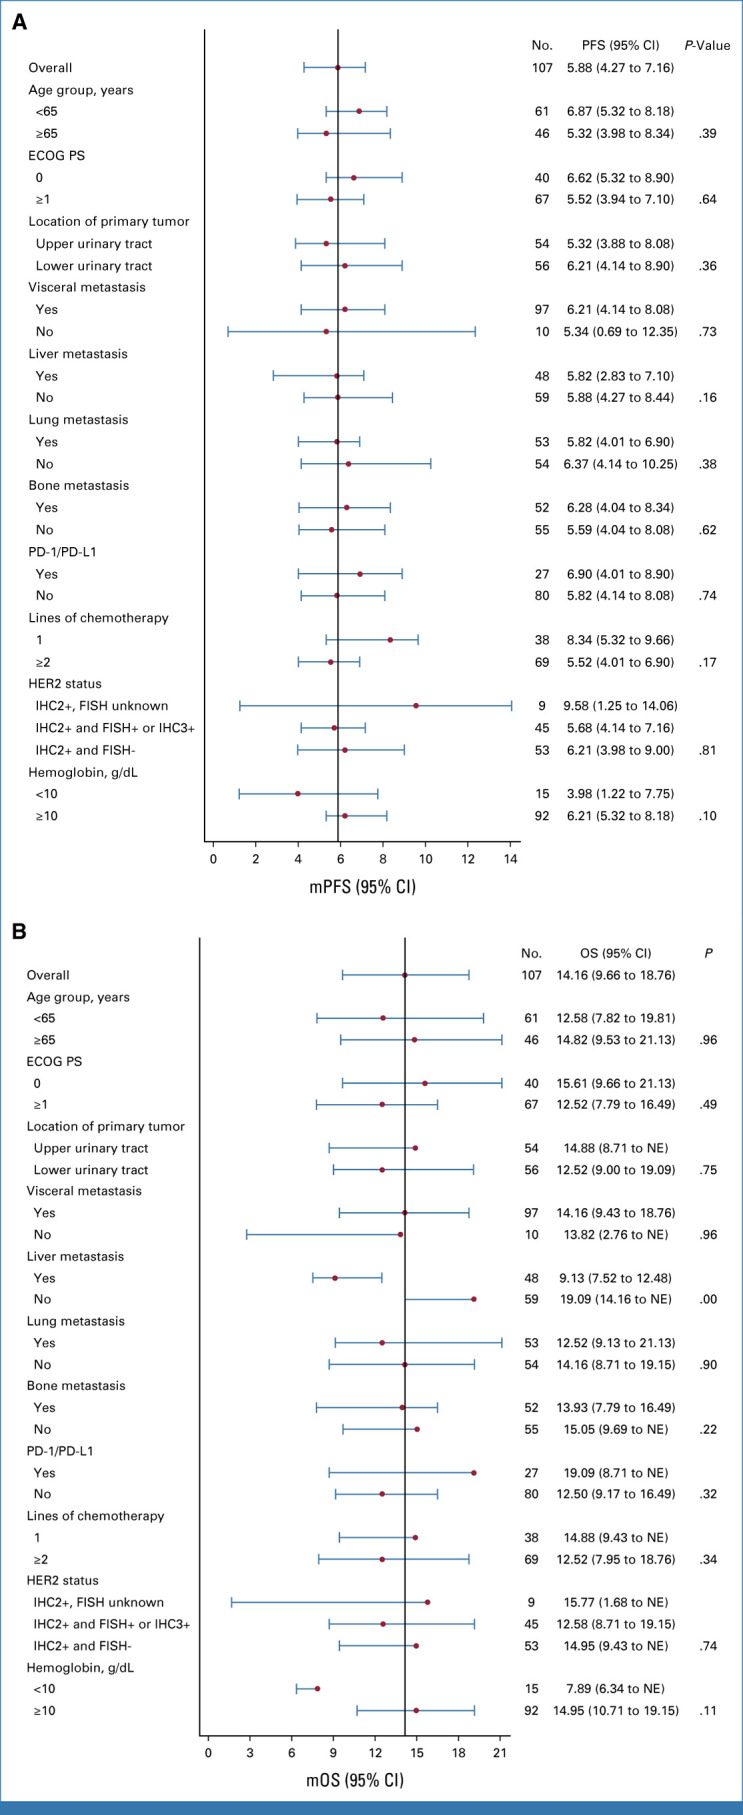
FIG A3.

Forest plot of the (A) mPFS and (B) mOS in key subgroups. The subgroups were based on the baseline disease characteristics. ECOG PS, Eastern Cooperative Oncology Group Performance Status; FISH, fluorescence in situ hybridization; HER2, human epidermal growth factor receptor 2; IHC, immunohistochemistry; mOS, median OS; mPFS, median PFS; NE, not estimable; OS, overall survival; PFS, progression-free survival.
