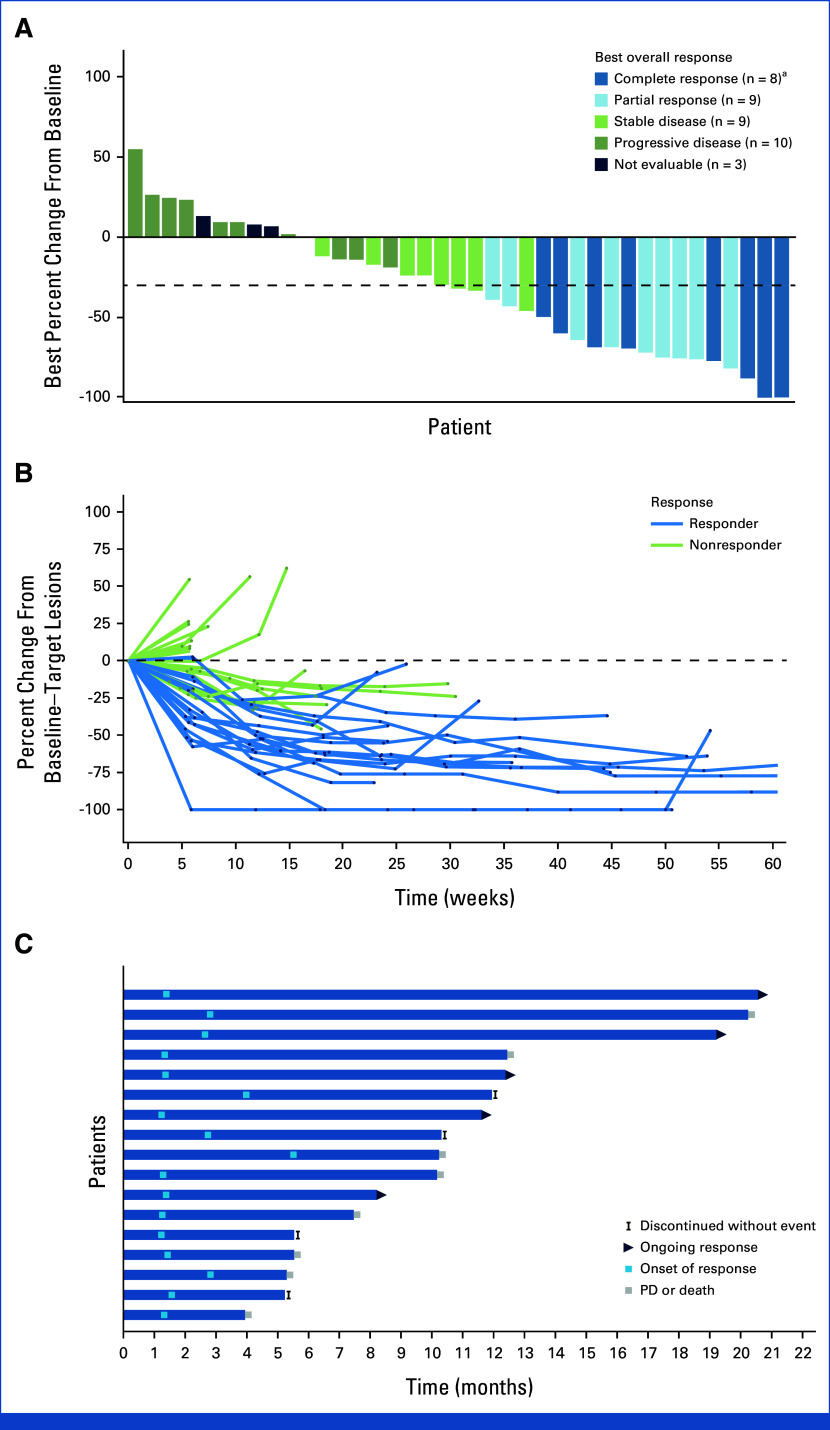
FIG 3.
Tumor responses per central review. (A) Waterfall plot showing best percentage change from baseline in the sum of the diameters of the target lesions in 39 patients (excludes two patients who were missing percentage change from baseline). The dashed line indicates threshold for partial response, according to RECIST v1.1. Target lesions were reduced in 72% of patients (28 of 38) with at least one postbaseline target lesion measurement. (B) Spider plot of tumor response by week. (C) Swimmer plot of response and duration. aPatients who achieved a complete response without a 100% reduction relative to the assessment at baseline had a lymph node as the target lesion. PD, progressive disease.

