. 2024 May 15;12:RP89912. doi: 10.7554/eLife.89912

Figure 2. Mecp2 fine-tunes quiescence exit in hepatocytes after partial hepatectomy (PHx) in vivo.

(A–D) Liver regeneration in Mecpfl/fl and Mecp2 cKO mice after PHx. (A) Real-time PCR to measure mRNA levels of Mecp2. The effects and corresponding quantification of Mecp2 KO on quiescence exit and liver regeneration were assessed by western blotting (WB) of Mecp2, pRb, and Cyclin D1 (B), immunofluorescence (IF) staining of Mecp2 (red) and Ki67 (green) in liver sections (C), and liver index of control and Mecp2 cKO mice (D) at the indicated time points. (E–H) Liver regeneration in Mecp2fl/fl livers without (AAV-EV) or with AAV-mediated Mecp2 OE (AAV-Mecp2) after PHx. AAV, adeno-associated virus; EV, empty vector. (E) Real-time PCR to measure mRNA levels of Mecp2. (F–H) The effects and corresponding quantification of Mecp2 OE on quiescence exit and liver regeneration were assessed by WB of Mecp2, pRb, and Cyclin D1 (F), IF staining of Mecp2 (red) and Ki67 (green) in liver sections (G), and liver index at the indicated time points (H). (I–L) Liver regeneration in Mecp2 cKO livers without (Mecp2 cKO/AAV-EV) or with AAV-mediated Mecp2 restoration (Mecp2 cKO/AAV-Mecp2) after PHx. (I) Real-time PCR to measure mRNA levels of Mecp2. (J–L) The effects and corresponding quantification of Mecp2 restoration on quiescence exit and liver regeneration in Mecp2 cKO livers were assessed by WB of Mecp2, pRb and Cyclin D1 (J), IF staining of Mecp2 (red) and Ki67 (green) in liver sections (K), and liver index (L) at the indicated time points. Data are presented as means ± SEM. In (A, E, I), n = 6; (B, F, J), n = 3; in (D, H, L), n = 5 mice/group. n.s., not significant; *p<0.05; **p<0.01; ***p<0.001; ****p<0.0001 by two-way ANOVA.

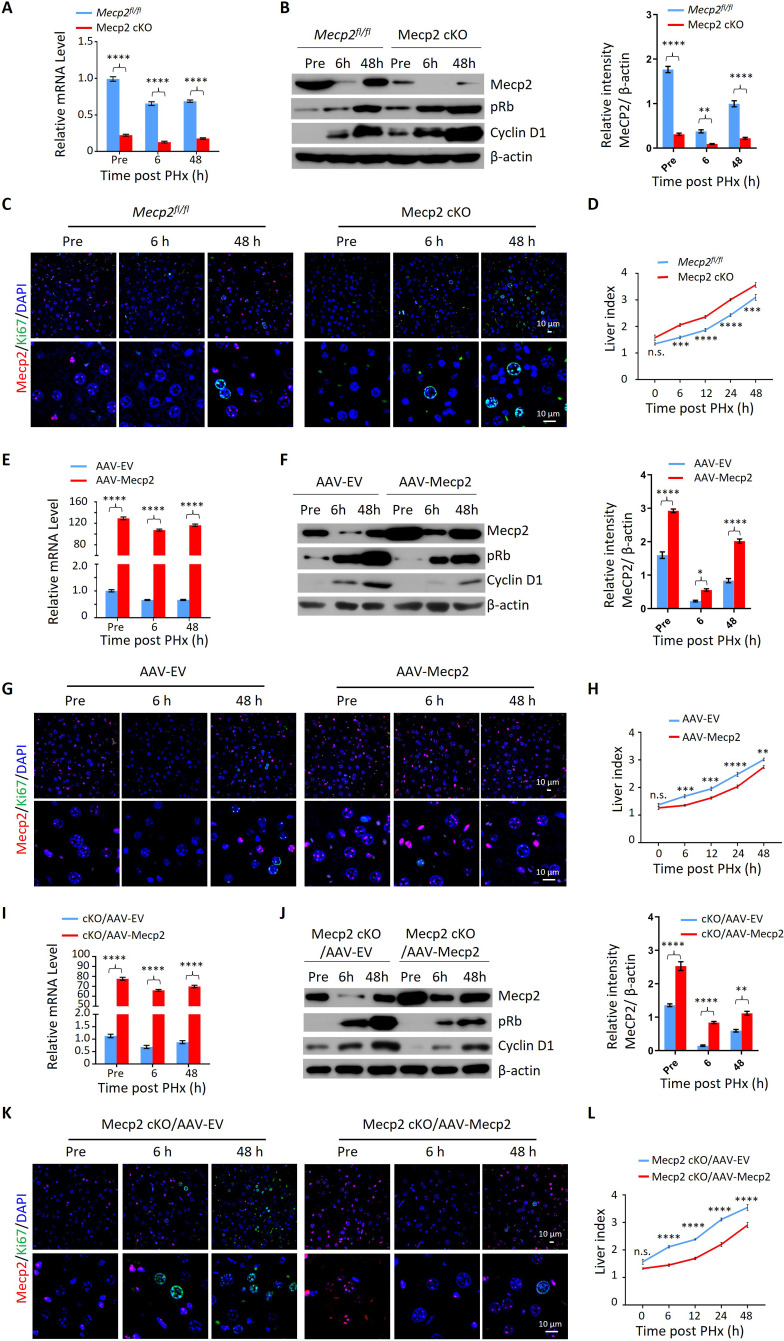
Figure 2—source data 1. Mecp2 fine-tunes quiescence exit in hepatocytes after partial hepatectomy (PHx) in vivo.
elife-89912-fig2-data1.xlsx (659.3KB, xlsx)

Figure 2.

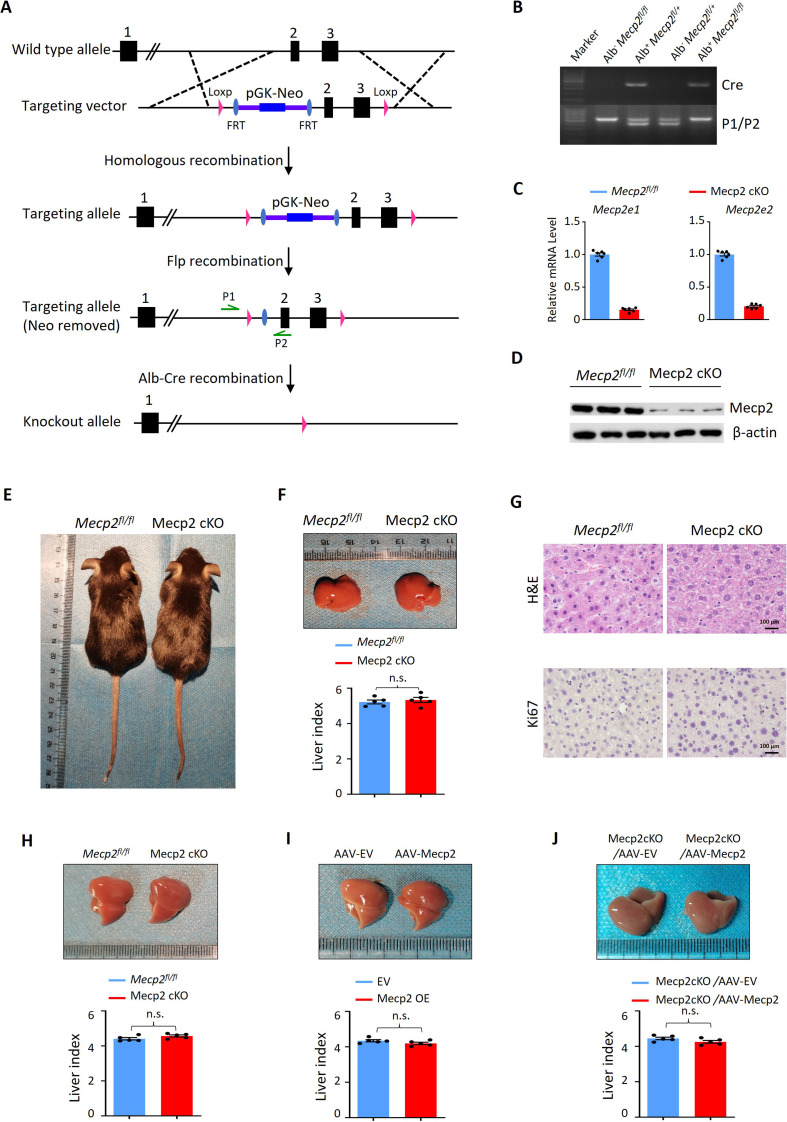
Figure 2—figure supplement 1. Modulation of Mecp2 expression in the mouse liver.

Figure 2—figure supplement 1.

(A) Schematic diagram of loss of Mecp2 in mouse hepatocyte. In the Mecp2 floxed allele, Mecp2 exons 2 and 3 were flanked with loxp sites. The Neo-cassette was removed by mating with FLP recombinase homozygous mice. Exons 2 and 3 were deleted by mating with Alb-Cre recombinase homozygous mice. (B–D) Evaluation of hepatocyte-specific depletion of Mecp2 by genotyping (B), real-time PCR (C), and western blotting (WB) (D) in Mecp2fl/fl and Mecp2 cKO livers. Data are presented as means ± SEM. n = 6 mice/group; ****p<0.0001 by one-way ANOVA. (E) Representative images of Mecp2fl/fl and Mecp2 cKO mice at 3 months of age. (F) Representative liver morphology and liver index of Mecp2fl/fl and Mecp2 cKO mice before PHx. Data are presented as means ± SEM. n = 5 mice/group; n.s., not significant by Student’s t-test. (G) Representative H&E staining and immunohistochemistry (IHC) for Ki67 images of liver tissues from Mecp2fl/fl and Mecp2 cKO mice before PHx. (H) Representative liver morphology and liver index of Mecp2fl/fl and Mecp2 cKO mice at 7 d post-PHx. Data are presented as means ± SEM. n = 5 mice/group; n.s., not significant by Student’s t-test. (I) Representative liver morphology and liver index of Mecp2fl/fl mice without (AAV-EV) or with (AAV-Mecp2) AAV-mediated Mecp2 overexpression at 7 d post-PHx. EV, empty vector. Data are presented as means ± SEM. n = 5 mice/group; n.s., not significant by Student’s t-test. (J) Representative liver morphology and liver index of Mecp2-cKO mice without (Mecp2 cKO/AAV-EV) or with (Mecp2 cKO/AAV-Mecp2) the rescue of Mecp2 at 7 d post-PHx. Data are presented as means ± SEM. n = 5 mice/group; n.s., not significant by Student’s t-test.
Figure 2—figure supplement 1—source data 1. Modulation of Mecp2 expression in the mouse liver.