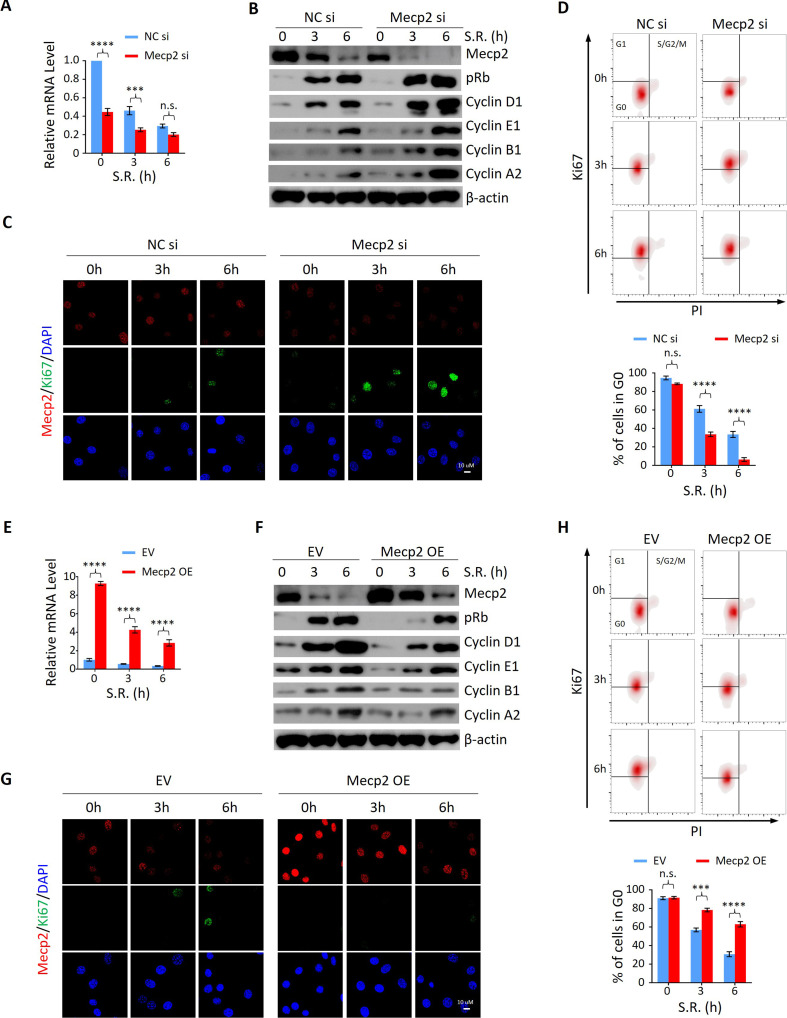
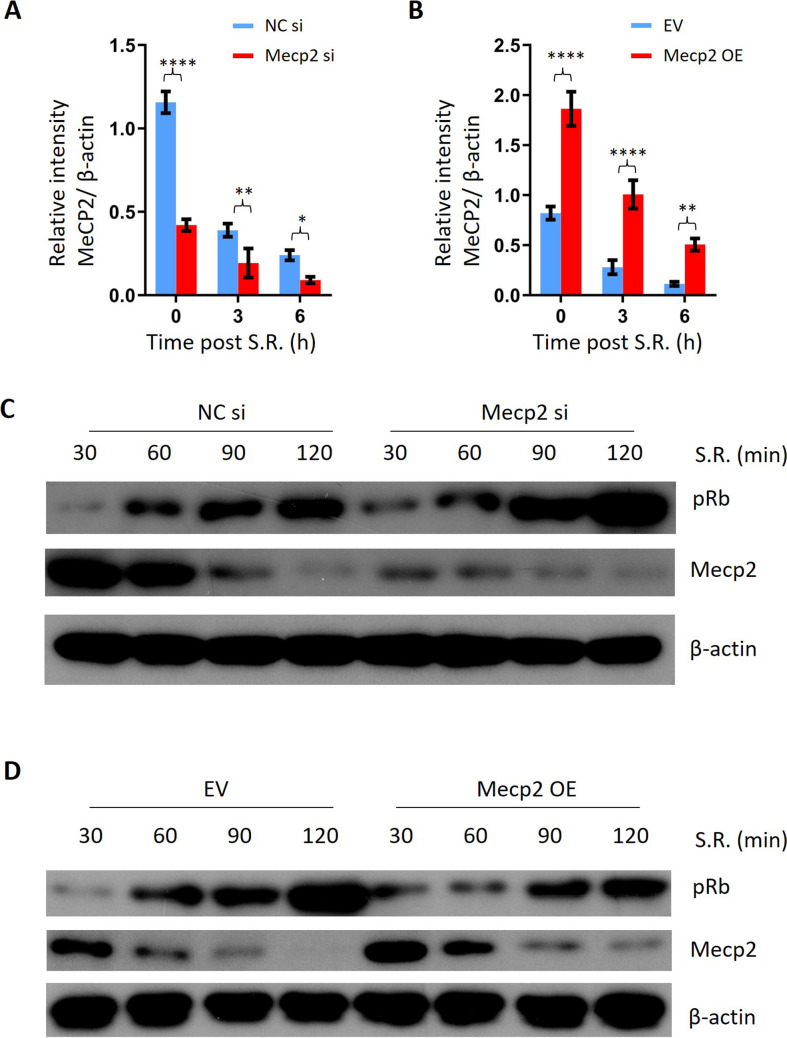
Figure 4. Mecp2 negatively regulates the G0/G1 transition in the cellular model of serum restimulation (SR)-induced quiescence exit.
(A) Real-time PCR showing the mRNA levels of Mecp2 in 3T3 cells transfected with negative control siRNA (NC si) or Mecp2 siRNA (Mecp2 si) at the early stages of SR-induced cell cycle reentry. Data are presented as means ± SEM; n = 6. n.s., not significant; ***p<0.001; ****p<0.0001 by two-way ANOVA. (B) Western blotting (WB) of Mecp2, pRb, Cyclin D1, Cyclin E1, Cyclin A2, and Cyclin B1 in control and Mecp2 knockdown (KD) 3T3 cells released from serum starvation (SS)-induced quiescence at the indicated time points. (C) Representative immunofluorescence (IF) staining of Mecp2 and Ki67 in control and Mecp2 KD 3T3 cells upon SR-induced quiescent exit. (D) Ki67 and propidium iodide (PI) double staining followed by flow cytometry showing cell cycle profiles of 3T3 cells transfected with NC or Mecp2 siRNA upon SR-induced quiescence exit. Cells in G0, G1, and S/G2/M phases were defined by Ki67−/2N DNA content, Ki67+/2N DNA content and >2N DNA content population, respectively. Lower panel: quantification of the percentage of 3T3 cells in the G0 phase. Data are presented as means ± SEM; n = 3. n.s., not significant; ****p<0.0001 by two-way ANOVA. (E) Real-time PCR showing the mRNA levels of Mecp2 in 3T3 cells transduced with the empty vector (EV) or the vector overexpressing Mecp2 (Mecp2 overexpression [OE]) at the early stages of quiescence exit. Data are presented as means ± SEM; n = 3. ****p<0.0001 by two-way ANOVA. (F) WB of Mecp2, pRb, Cyclin D1, Cyclin E1, Cyclin A2, and Cyclin B1 in control and Mecp2 OE 3T3 cells released from SS-induced quiescence at the indicated time points. (G) Representative IF staining of Mecp2 and Ki67 in quiescent control and Mecp2 OE 3T3 cells upon SR. (H) Representative flow cytometry plots of Ki67/PI double staining in control and Mecp2 OE 3T3 cells upon SR-induced quiescence exit. Lower panel: quantification of proportion of 3T3 cells in the G0 phase. Data are presented as means ± SEM; n = 3. n.s., not significant; ***p<0.001; ****p<0.0001 by two-way ANOVA.


