. 2024 May 15;12:RP89912. doi: 10.7554/eLife.89912

Figure 6. Mecp2 transcriptionally regulates quiescence exit.

(A) Heatmap of Mecp2 direct target genes at the early stage of liver regeneration rank-ordered by their gene expression fold change. (B) The top 10 most significantly overrepresented Gene Ontology (GO) terms for the partial hepatectomy (PHx)-activated (red) and PHx-repressed (green) Mecp2 target genes. (C) Heatmaps depicting ChIP-seq enrichment of Mecp2 at the promoter-proximal region (3 kb away from transcription start sites [TSS]) and the defined gene region of Mecp2 target genes in Mecpfl/fl and Mecp2 cKO livers before and 6 hr post-PHx. Genes are rank-ordered according to the fold change of expression. (D) Real-time PCR validation of PHx-repressed NRs in Mecp2fl/fl and Mecp2 cKO livers upon PHx. Data are presented as means ± SEM; n = 5. n.s., not significant; **p<0.01; ****p<0.0001 by two-way ANOVA.

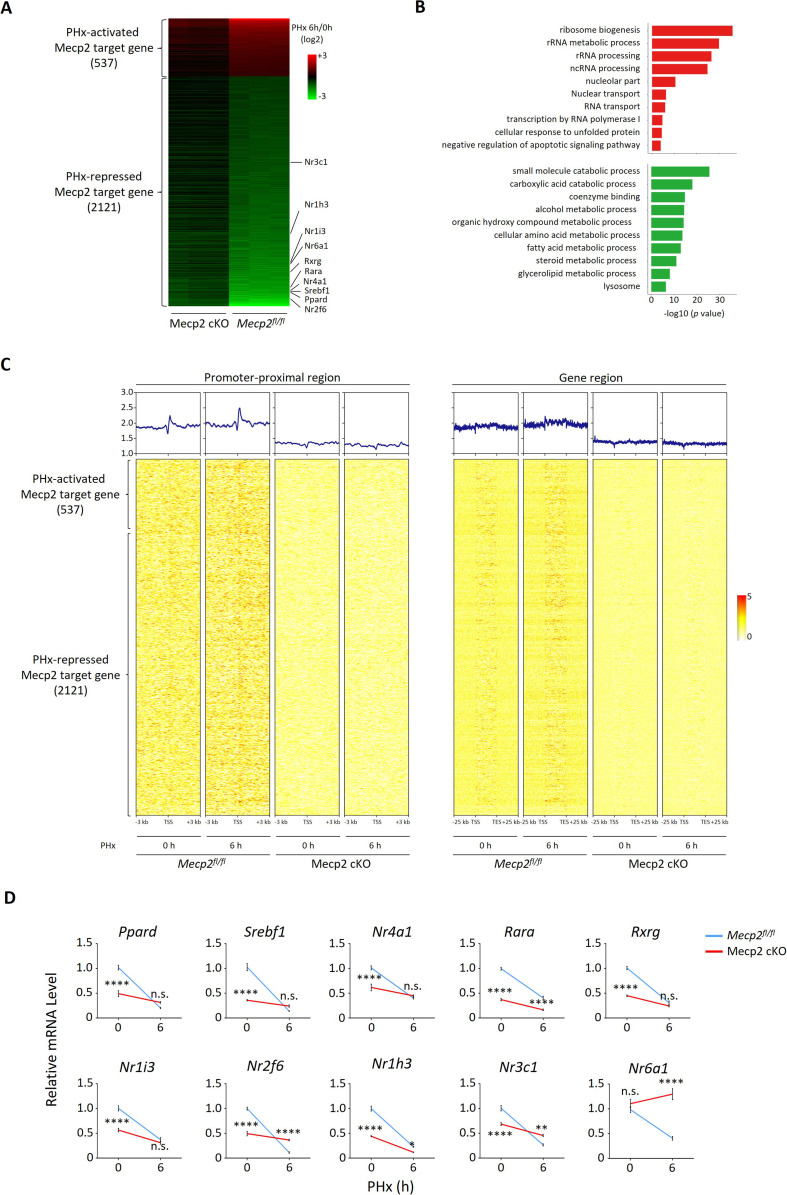
Figure 6—source data 1. Mecp2 transcriptionally regulates quiescence exit.
elife-89912-fig6-data1.xlsx (744.6KB, xlsx)

Figure 6.

Figure 6—figure supplement 1. Related to Figure 6.

Figure 6—figure supplement 1.

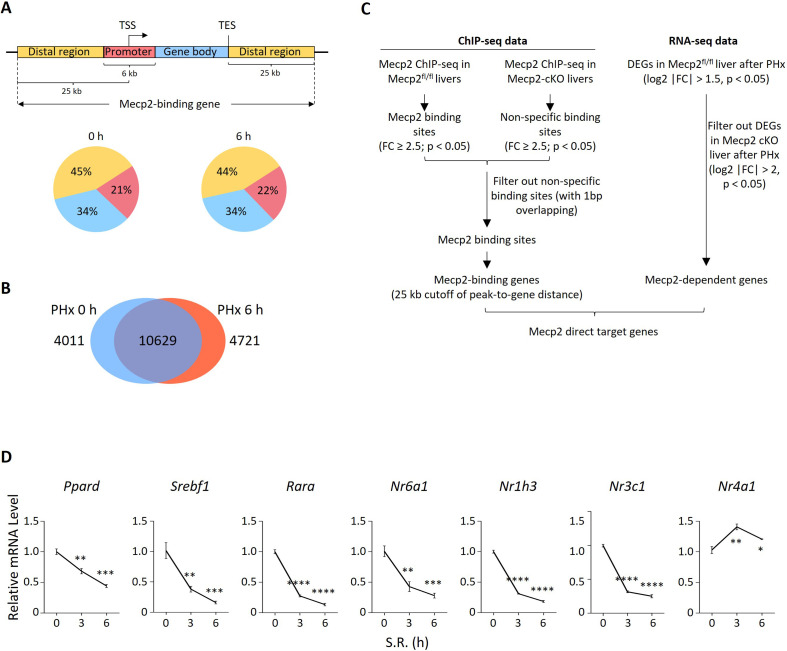
(A) Schematic showing the definition of Mecp2-binding genes. Lower panel: distribution of Mecp2 peaks in defined promoter-proximal, gene body, and distal regions. TSS, transcriptional start site; TES, transcriptional end site. The cutoff of distance of peak-to-gene is 25 kb. (B) Venn diagram overlap of Mecp2 binding genes in Mecp2fl/fl livers before (0 hr) and after partial hepatectomy (PHx) (6 hr). (C) Pipeline showing the integration of Mecp2 ChIP-seq data with RNA-seq data to identify Mecp2-direct target genes. (D) Real-time PCR validation of PHx-repressed NRs in 3T3 cells upon serum restimulation (SR)-induced quiescence exit. Data are presented as means ± SEM; n = 3. *p<0.05; **p<0.01; ***p<0.001; ****p<0.0001 by one-way ANOVA.
Figure 6—figure supplement 1—source data 1. Raw data related to Figure 6—figure supplement 1.