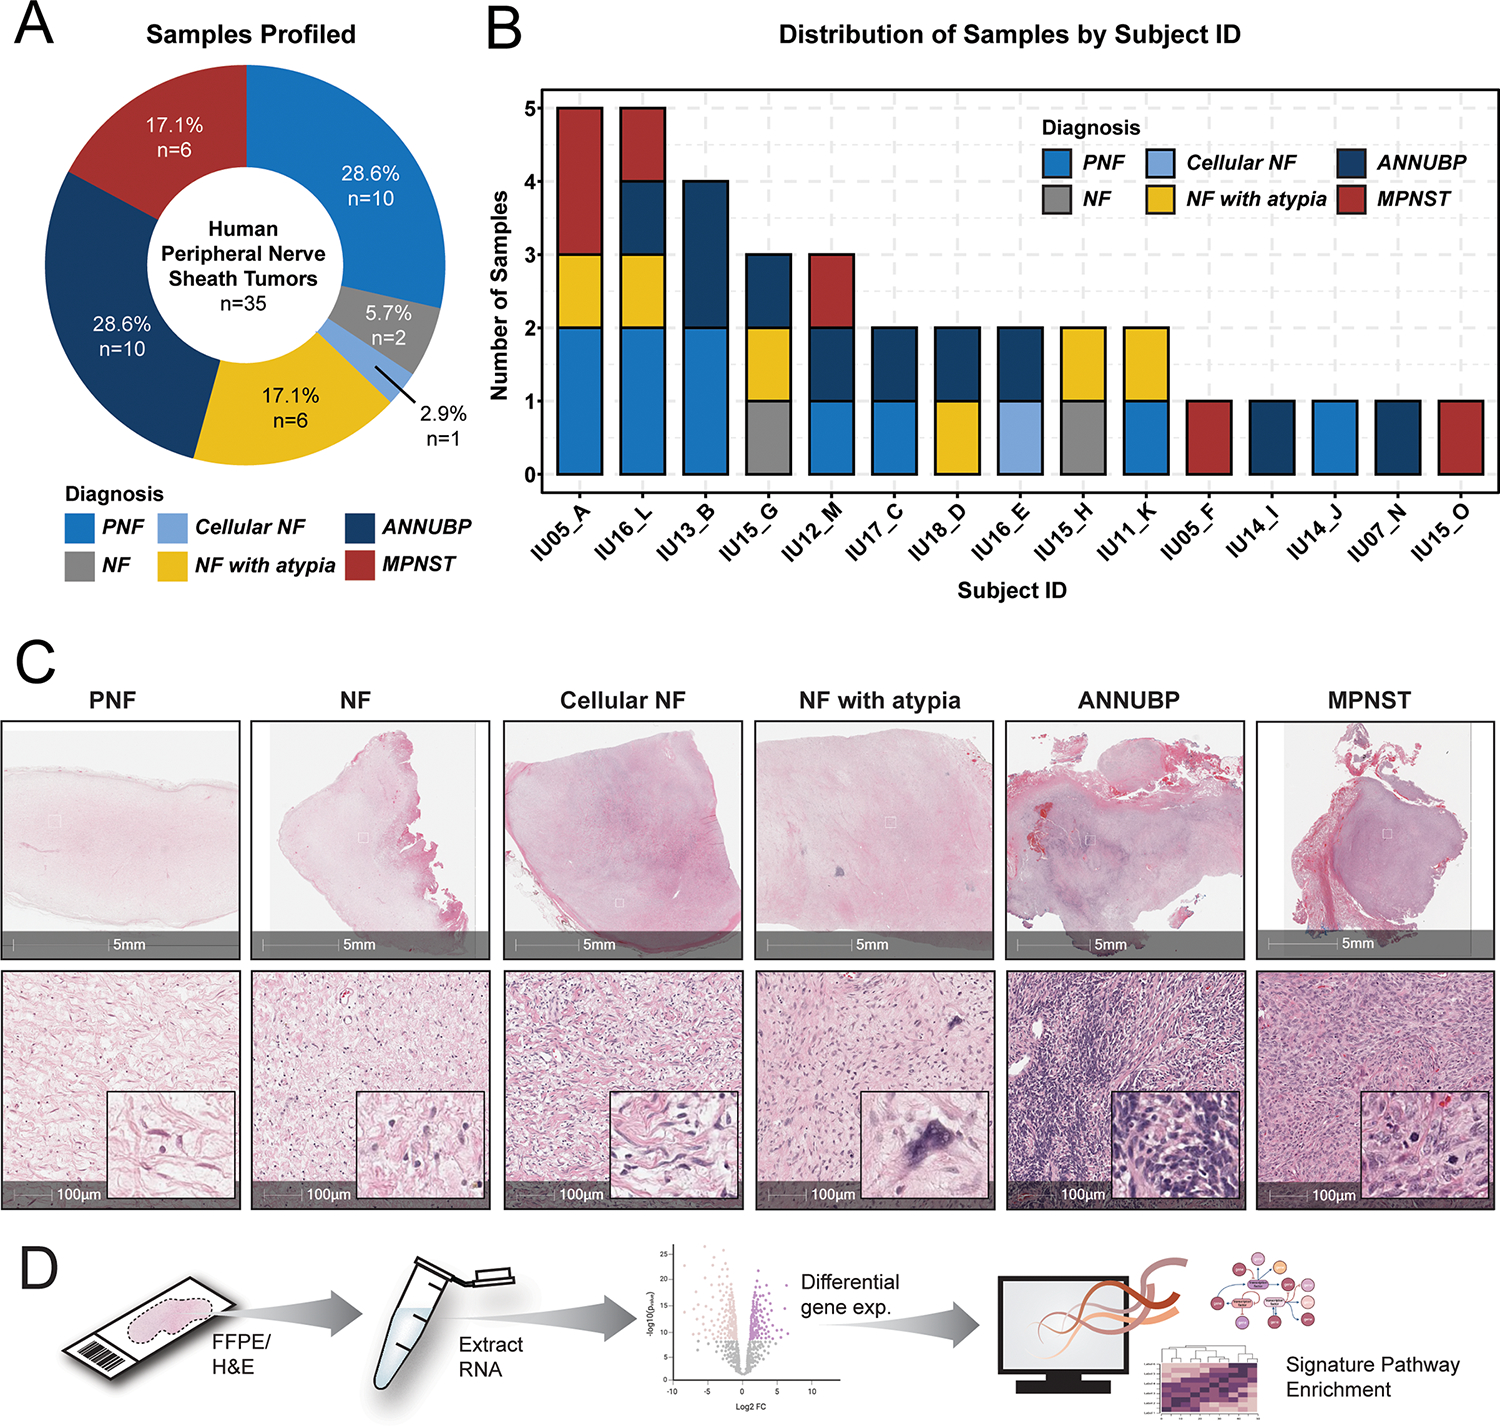
Figure 1. Spatial gene expression profiling of NF1-associated PNST.

(A) Donut plot depicting the distribution of samples by tissue diagnosis. (B) Stacked barplot illustrating the distribution of tumor subtypes by subject ID. (C) Representative photomicrographs of H&E-stained sections of each tumor subtype represented in the analysis including neurofibroma (NF), plexiform neurofibroma (PNF), cellular neurofibroma (cellular NF), neurofibroma with atypia (NF with atypia), atypical neurofibromatous neoplasm of uncertain biological potential (ANNUBP), and malignant peripheral nerve sheath tumor (MPNST). 5 mm (top panel) and 100 μm scale bars (bottom panel) denote the magnification, with insets at high power. (D) Schematic depicting experimental workflow and analysis. Tissue was microdissected from annotated regions and RNA was extracted for gene expression profiling using the using the Nanostring nCounter platform (IO360 panel).
