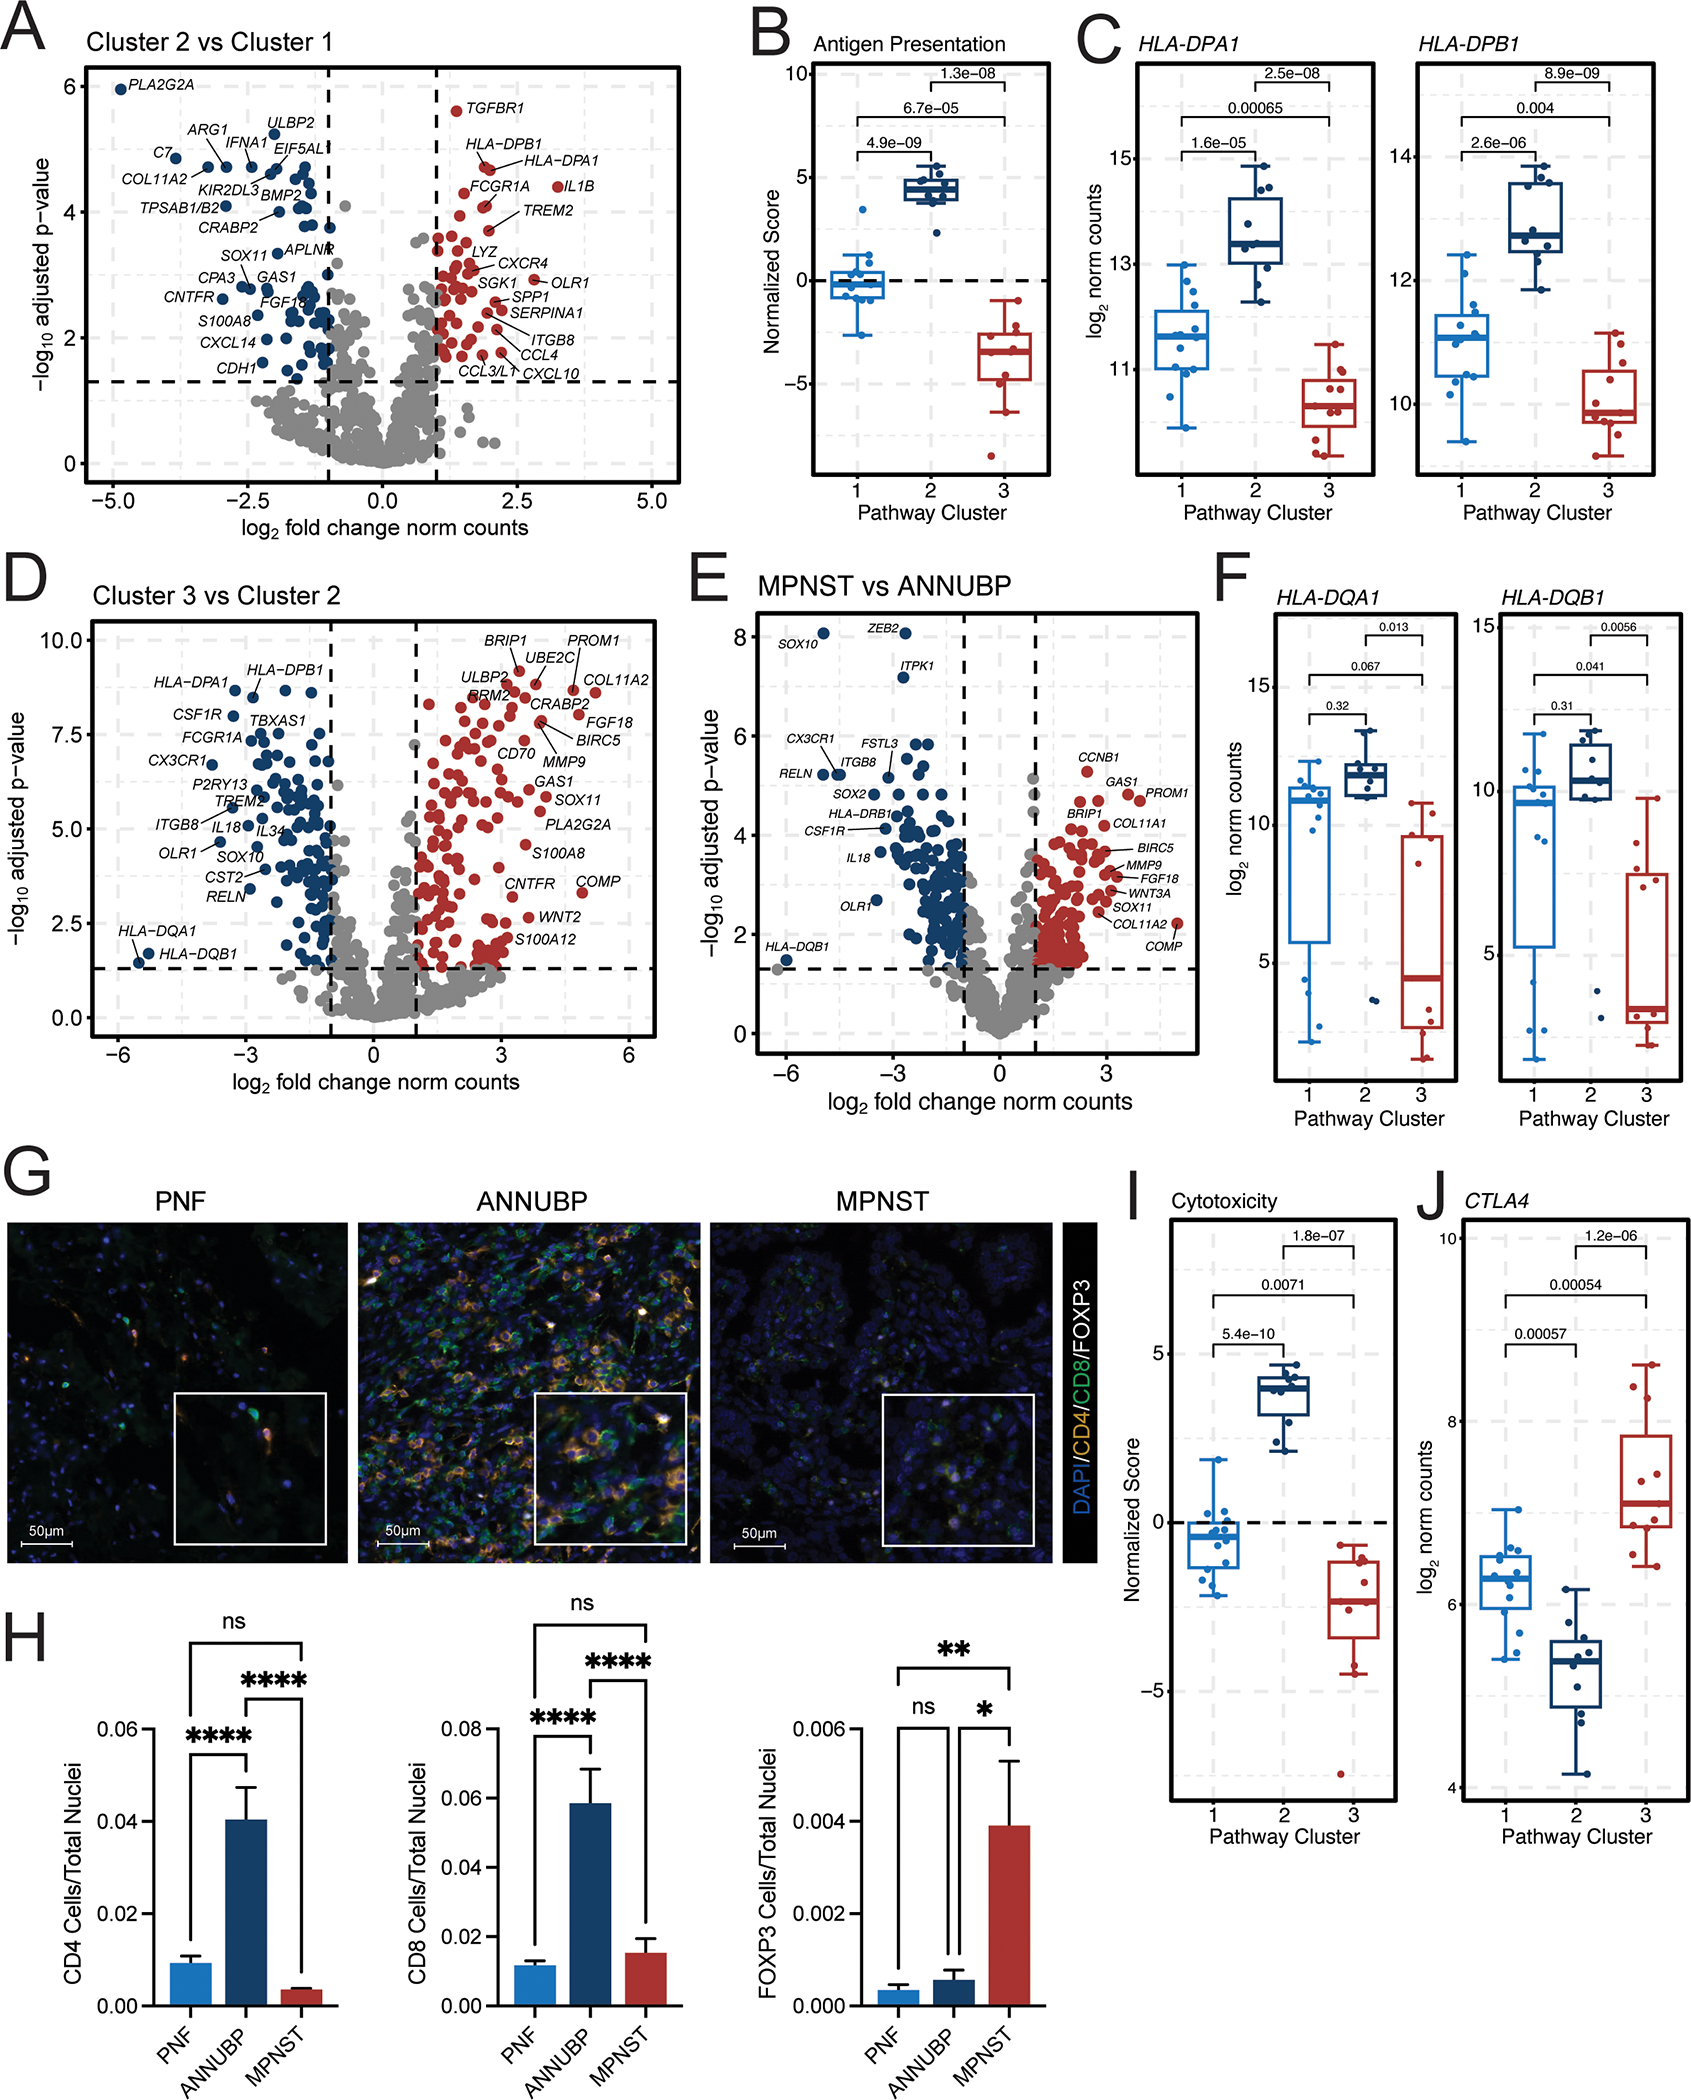
Figure 3. ANNUBP and Cluster 2 lesions are characterized by enhanced signatures of antigen presentation, immune surveillance and T cell infiltration.

(A) Volcano plots illustrating the top differentially expressed genes in Cluster 2 (n=10) versus Cluster 1 (n=14) lesions. The x-axis represents the log2 fold change in gene expression, whereas the y-axis represents the −log10 Benjamini Hochberg adjusted p-value. An adjusted p-value of 0.05 was set as the false discovery threshold as denoted by the dotted line. Genes with log2 fold changes ≥1 are colored red, whereas those with log2 fold changes ≤ −1 are colored blue. (B) Box and whisker plot of normalized antigen presentation signature scores in Cluster 1 (n=14), Cluster 2 (n=10), and Cluster 3 (n=11) tumors. Dots represent individual samples. Whiskers extend from the minima to maxima that are no further than 1.5x the inter-quartile range spanning the first to third quartiles. The center line represents the median. The box spans the 25th to 75th percentiles. Data beyond the whiskers are outliers and are plotted as individual points. P-values represent unpaired, two-tailed t-tests between groups as shown. (C) Box and whisker plots depicting HLA-DPA1 and HLA-DPB1 mRNA expression (normalized counts) stratified by molecular cluster. P-values represent unpaired, two-tailed t-tests between groups. (D) Volcano plot illustrating the top differentially expressed genes in Cluster 3 (n=11) vs Cluster 2 (n=10) lesions. (E) Volcano plot showing top differentially expressed genes in MPNST (n=6) vs ANNUBP (n=10). (F) Box and whisker plots depicting HLA-DQA1 and HLA-DQB1 mRNA expression (normalized counts) stratified by molecular cluster. (G) Representative photomicrographs of T cell subsets identified by immunofluorescence staining of CD4 (orange), CD8 (green) and FOXP3 (white) in PNF, ANNUBP and MPNST tissue sections. DAPI (blue) is shown as a nuclear counterstain. Magnification denoted by 100 μm scale bars with inset high-power magnification as shown. (H) Barplots reflecting quantitative analysis of T cell subsets normalized to the total number of nuclei per high power field (HPF). Error bars reflect standard error of the mean (SEM). PNF (n=6, ROI=30), ANNUBP (n=4, ROI=20) and MPNST (n=5, ROI=25) were analyzed by one-way ANOVA using Tukey’s multiple comparisons test. (I) Box and whisker plot of normalized cytotoxicity signature scores in Cluster 1 (n=14), Cluster 2 (n=10), and Cluster 3 (n=11) tumors. P-values represent unpaired, two-tailed t-tests between groups as shown. (J) Box and whisker plot depicting CTLA4 mRNA expression (normalized counts) stratified by molecular cluster. P-values represent unpaired, two-tailed t-tests between groups.
