
Figure 1.
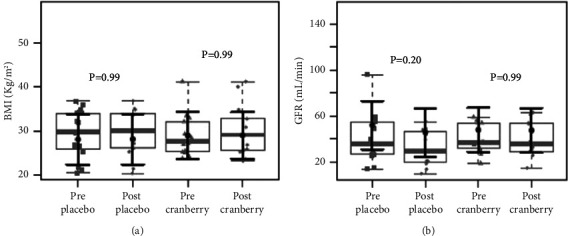
Body index mass (BMI) (a) and glomerular filtration rate (GFR) (b) before and after two months of placebo and cranberry supplementation. There were no differences in body index mass (BMI) (a) and glomerular filtration rate (GFR) (b) after two months of intervention in both groups. The sample distributions of data in grey are represented in boxplots and strip plots. In black, the central circle represents the mean expected marginal effect for each group estimated from linear mixed-effects models. The fixed effects in the models were the intervention group, the time, its interaction, and the confounding variables: sex, age, systemic arterial hypertension (SAH), and diabetes mellitus (DM). Individuals were included as a random effect. Black horizontal bars represent the 95% confidence intervals of the expected mean marginal effects by the group. p values were corrected for the number of contrasts/two-by-two comparisons by Tukey's honest significant difference (HSD) method.