
Figure 2. A group 2 HA stem immunogen elicits vaccine protection from group-unmatched influenza virus, but only when VH1–18 QxxV bnAb precursors are present at physiological frequency.
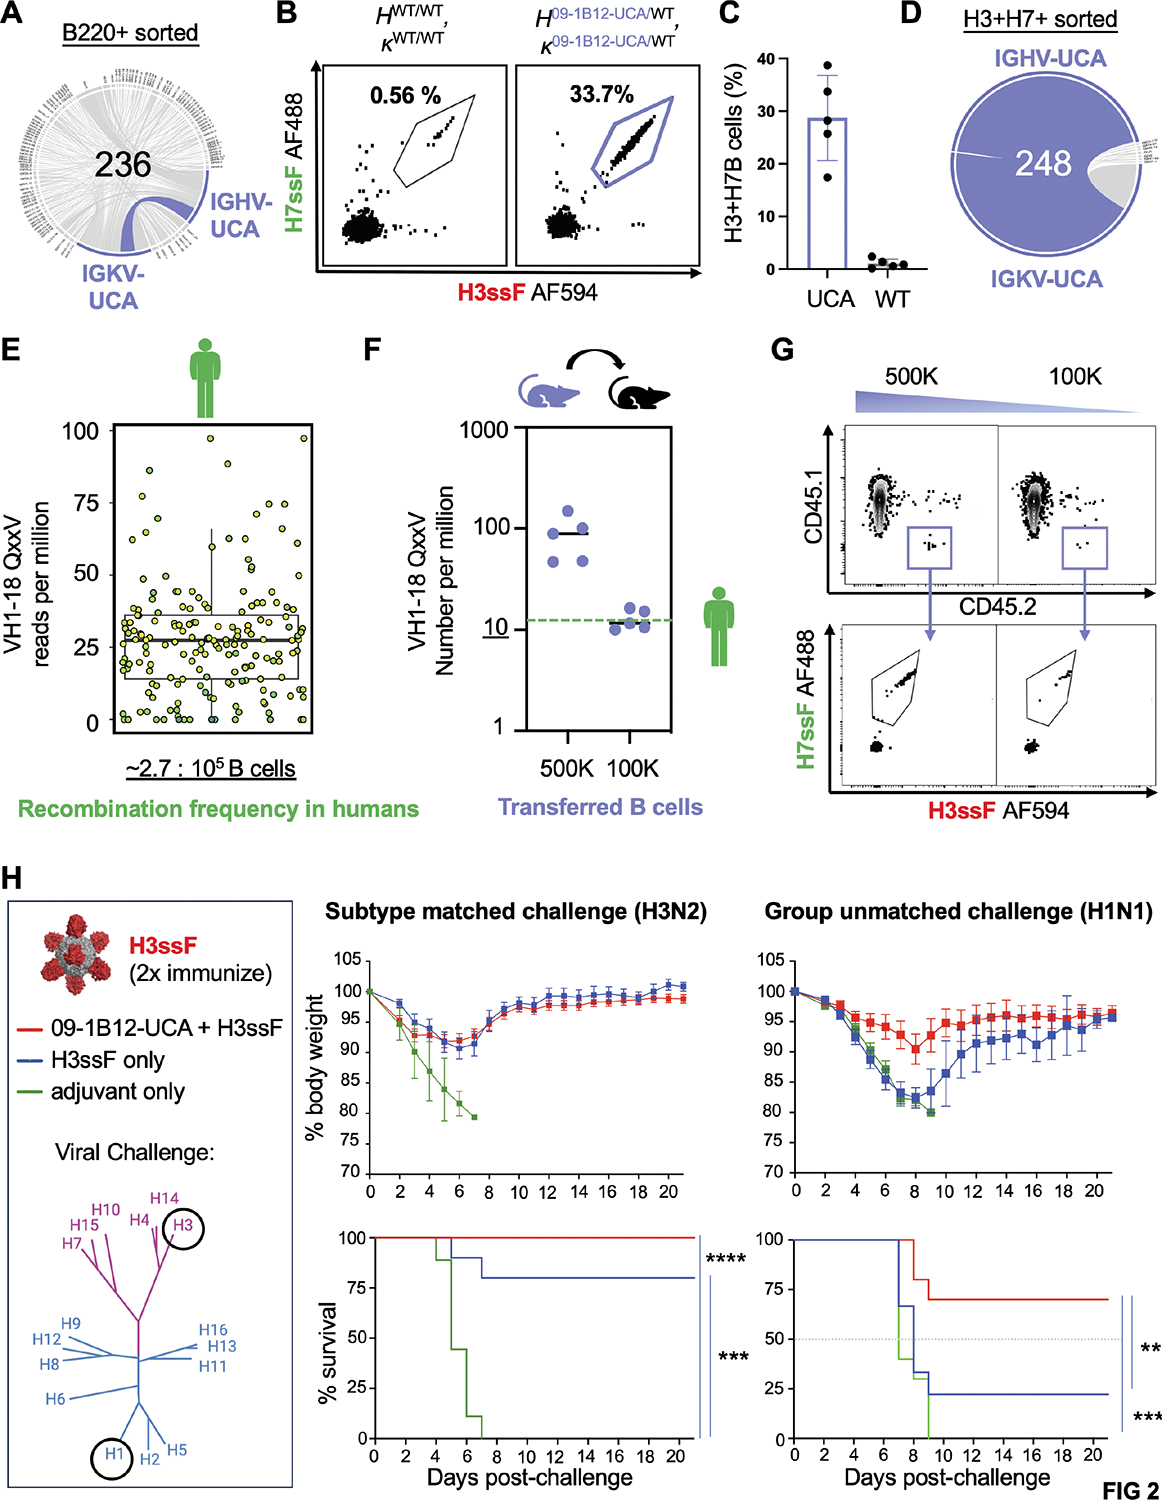
(A) HC and LC sequencing of B220+ cells from CD45.2 09–1B12-UCA donor mice (H09–1B12-UCA/WT, κ09–1B12-UCA/WT) (one mouse, one experiment). Of these cells 11.02% were paired IGHV/IGKV for the VH1–18 QxxV 09–1B12-UCA sequence. (B) B220+ B cell cross-reactivity to H3ssF-AF594 and H7ssF-AF488 in WT C57Bl/6 versus 09–1B12-UCA donor mice. These cross-reactive B cells were also not specific for the ferritin scaffold as they did not bind H3ssF-KO or H7ssF-KO (central stem epitope KO = N-linked glycan at 45HA2). (C) Proportion of the H3+/H7+ cross-reactive B cells in WT C57Bl/6 versus 09–1B12-UCA donor mice (H3ssF+/H7ssF+/ H3ssF-KO−/H7ssF-KO−) (n=5, mean ± SD, one experiment). (D) Enrichment of the VH1–18 QxxV UCA in cross-reactive B cells was observed at 83.5% (one mouse, one experiment). (E) Box plot of frequencies of the VH1–18 QxxV bnAb precursors among IgM antibody repertoires of n=10 human subjects41. A box plot containing the biological and technical replicates is presented; a separate breakdown of these values in each individual human subject is presented in Figure S4A. From this data we obtain a median bnAb precursor frequency of 2.7 per 100,000 B cells. (F,G) To recapitulate this value in the B cell repertoires of CD45.1 mice, we transferred CD45.2 09–1B12-UCA B cells (H09–1B12-UCA/WT, κ09–1B12-UCA/WT) at increasing amounts and then measured the VH1–18 QxxV bnAb precursor frequency (H3ssF+/H7ssF+/ H3ssF-KO−/H7ssF-KO−) in the spleen of the recipient mice. Transfer of 100,000 09–1B12-UCA B cells reproducibly gave a value of ~1 in 100,000 B cells (n=5 recipient mice per transfer amount, one experiment), consequently this was the VH1–18 QxxV bnAb precursor frequency used in all subsequent immunization experiments. (H) 09–1B12-UCA B cells were transferred (or not transferred) to recipient mice that were 2x sequentially immunized with H3ssF (day 0 prime + day 42 boost) and then lethally challenged (day 56) with subtype matched H3N2 influenza virus [108 TCID50/ml X-31] or group unmatched H1N1 influenza virus [104 TCID50/ml mouse-adapted A/California/2009 (maA/Cal/09)75,76]. The genetic distance of these influenza virus subtypes is also shown by the accompanying phylogenetic tree of HA IAV diversity (group 2 = purple, group 1 = blue). Weight loss and survival were monitored over 21 days. For subtype-matched H3N2 challenge: ****P<0.0001 between 09–1B12-UCA cells + H3ssF versus Sigma adjuvant; ***P<0.001 between H3ssF alone vs Sigma adjuvant (n=10 mice per group, Mantel-Cox test of survivorship, one experiment). For group-unmatched H1N1: **P<0.025 between 09–1B12-UCA cells + H3ssF vs H3ssF alone; ***P<0.001 between 09–1B12-UCA cells + H3ssF vs Sigma adjuvant alone, where the n=2 surviving from H3ssF only group (absence of 09–1B12-UCA cells) was not statistically significant (P>0.05) (n=10 mice per group, Mantel-Cox test of survivorship, one experiment). See also Figure S2 and S3 (in relation to A–D) and Figure S4 (in relation to E).